
TileMill 快速入门
TileMill 让用户快速而轻松地创建网页地图服务。它使用强大的开源地图渲染函数库 Mapnik(Open Street Map 和 MapQuest 同样使用它)并以 CartoCSS 为样式配置语言。
本文演示:
- 从 PostGIS 添加图层
- 配置样式
- 添加工具提示
- 编辑图例
- 输出地图
新建项目
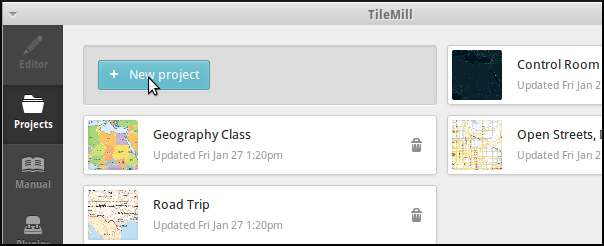
- 启动 TileMill 并选择 “New project” 新建项目。
2- 输入示例信息并点击 “Add”:
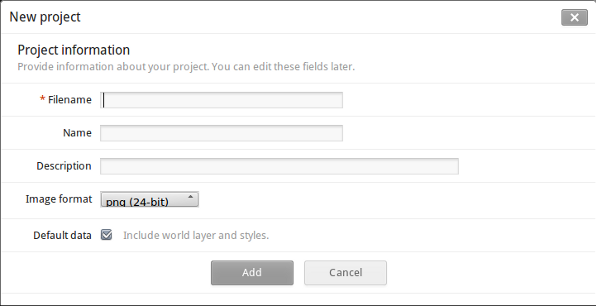
Filename: tilemill_quickstart
Name: TileMill Quickstart OSGeo Live
Description: Quickstart from OSGeo Live
Default Data: Leave selected
- 双击新项目打开。新建项目包含了一个默然图层 #countries 并以 CartoCSS 配置样式。
添加图层
TileMill 可以从文件、SQLite 和 PostGIS 读取图层。这里演示从 PostGIS 读取 OSM 数据。演示假设您已经熟悉 OSM 数据的结构。您可以通过 pgAdminIII 或 QGIS 、Open Jump 等桌面 GIS 系统了解 OSM 数据。
- 从 PostGIS 导入数据。首先,点击图层按钮(
 )并选择 ‘+ Add layer’ 添加图层。在 ‘Add layer’ 中选择数据源类型为 PostGIS:
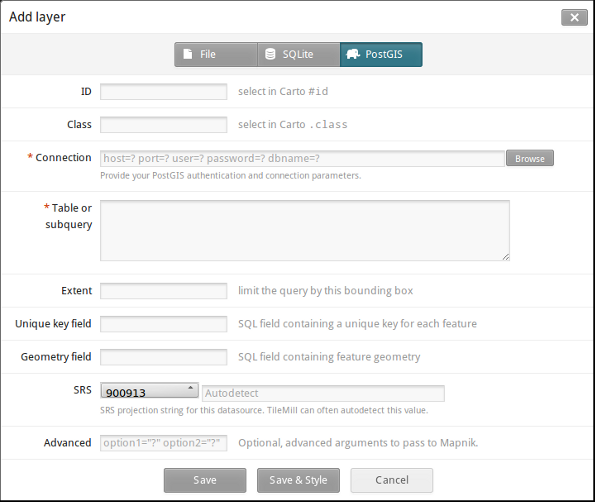
- 从 PostGIS 添加道路(roads)图层。选择图层后点击 ‘Save & Style’ 确认:
ID: osm_roads
Class: osmroads
Connection: host=localhost port=5432 user=user password=user dbname=osm_local
Table or subquery: planet_osm_roads
Unique key field: osm_id
Geometry field: way
SRS: Select WGS84
- 从 PostGIS 导入 osm_line 图层,选中后点击 ‘Save & Style’ 确认:
ID: osm_line
Class: osmline
Connection: host=localhost port=5432 user=user password=user dbname=osm_local
Table or subquery: planet_osm_line
Unique key field: osm_id
Geometry field: way
SRS: Select WGS84
- 从 PostGIS 导入 osm_points 位置点图层,选中后点击 ‘Save & Style’ 确认:
ID: osm_points
Class: osmpoints
Connection: host=localhost port=5432 user=user password=user dbname=osm_local
Table or subquery: (select osm_id, amenity, way from planet_osm_point where amenity is not null) AS amen
Unique key field: osm_id
Geometry field: way
SRS: Select WGS84
在 osm_points 图层中只选择了来自 osm_local 的一个子集,以保证其设施类型(amenity)属性非空。
 并移动到工程的目标区域设置中心点(center point)。在表格中也可以直接输入中心点和边界(bounds)坐标值。
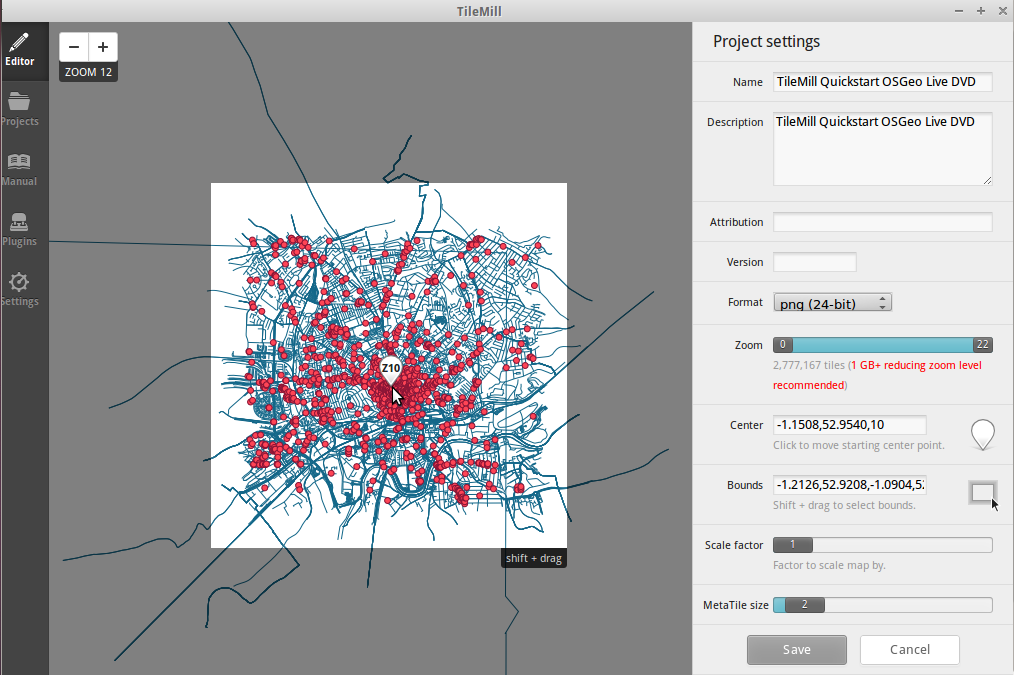
样式配置
TileMill 使用 CartoCSS 语言配置样式。颜色、尺寸、形状等均可由地图显示面板右侧相应的 CartoCSS 代码控制。有关 CartoCSS 语言的使用请参阅其教程。
点击 “Save & Style” 导入新的 PostGIS 图层后,若干项目会被自动添加默认值:
- #osm_point
目标图层名称
- marker-width
图标尺寸,单位为像素
- marker-fill
图标颜色,除了直接输入颜色代码,点击面板底部的颜料图标也可以编辑颜色
- marker-line-color
边界线颜色,编辑方法同上
- 5.- marker-allow-overlap
- 允许标记叠置,若未设为否(false),叠置的标记可能被遮挡而不显示
所有这些属性均可以在保存工程后修改。
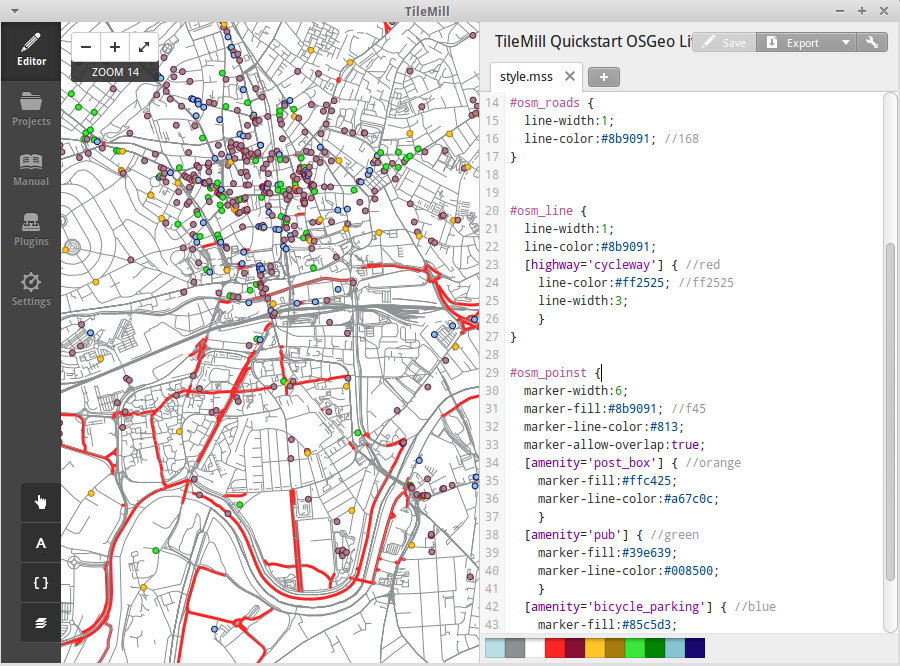
条件性样式
条件性样式是根据要素属性变化的样式。本例配置 osm_points 和 osm_roads 的样式,高亮显示具有特定属性的要素。
对于点要素,根据其表示的是 ‘post_box’(邮箱)、’pub’(酒吧)或 ‘bicyle_parking’(自行车位)等加以不同的图标。该信息位于设施类型(amenity)字段。道路类型(highway)为自行车道(cycleway)的道路要素将使用专门的符号表示。
实现上述效果的 CartoCSS 代码如下:
Map {
  background-color: #b8dee6;
}

#countries {
  ::outline {
    line-color: #8b9091;
    line-width: 2;
    line-join: round;
  }
  polygon-fill: #fff;
}

#osm_roads {
  line-width:1;
  line-color:#8b9091; //168
}


#osm_line {
  line-width:1;
  line-color:#8b9091;
  [highway='cycleway'] { //red
    line-color:#ff2525; //ff2525
    line-width:3;
    }
}

#osm_poinst {
  marker-width:6;
  marker-fill:#8b9091; //f45
  marker-line-color:#813;
  marker-allow-overlap:true;
  [amenity='post_box'] { //orange
    marker-fill:#ffc425;
    marker-line-color:#a67c0c;
    }
  [amenity='pub'] { //green
    marker-fill:#39e639;
    marker-line-color:#008500;
    }
  [amenity='bicycle_parking'] { //blue
    marker-fill:#85c5d3;
    marker-line-color:#180773;
    }
}
工具提示
工具提示是光标位于某些对象上时动态显示的内容。它可以包含 HTML 代码,显示各类数据、图形等。
- 在左下角点击
 开启模板(Templates)配置界面。
- 点击摘要(Teaser)选项卡。摘要信息是光标浮于目标之上而未点击时显示的信息。完整(Full)信息则会在点击时显示。在目标地址(Location)一栏可以填入一个希望打开的 URL 。
- 选中 ‘osm_point’ 图层作为交互层(interactive)。TileMill 目前只能同时处理一个交互层。
- 花括号标注是该图层的各个字段。这些代码在显示时会替换成相应字段。
- 边线工具提示代码。以下示例代码可用于摘要。
Type:{{{amenity}}}<br/>
Name:{{{name}}}
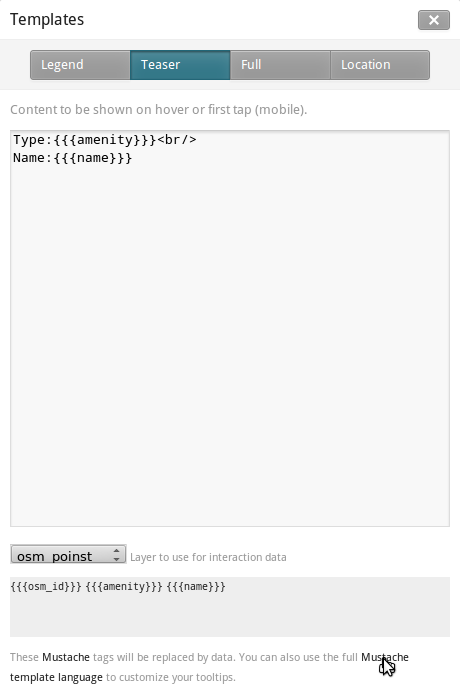
- 点击 “Save” 保存配置并刷新。点击 (X) 或键盘 ESC 关闭面板。移动光标查看工具提示的显示情况。

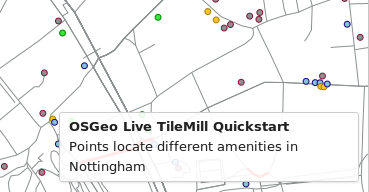
图例
图例可以在地图界面上方便地显示各类要素名称、分类、描述等。它可以使用 HTML,支持图片。
为示例项目添加一个图例:
- 打开模板试图。
- 图例(Legend)选项卡是默认项。
- 在 Legend 一栏输入内容。
<strong>OSGeo Live TileMill Quick Start</strong><br/>Points locate different amenities in Nottingham</br>
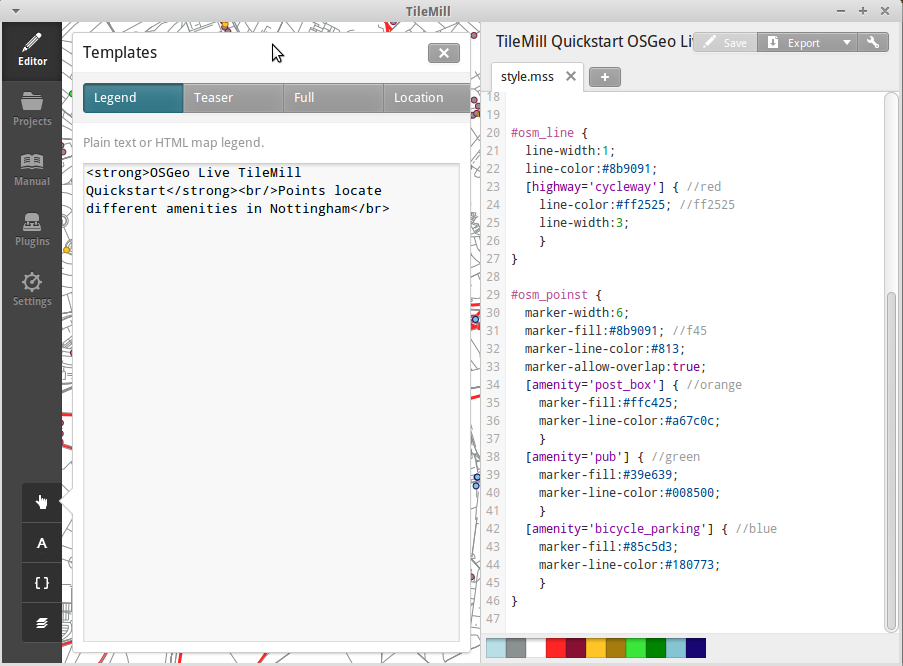
- Click save and close the panel. You will now see your legend in the bottom right corner of the map.
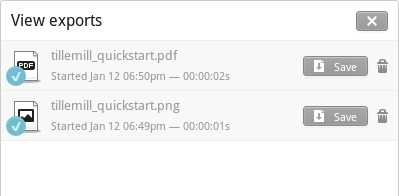
输出地图
TileMill 支持输出到 MBTiles、PNG、PDF、SVG 和 Mapnik XML 文件。详见 输出功能文档 。
输出到 MBTiles:
- 点击 “Export” 按钮。出现一个下拉菜单。
- 选择 “MBTiles”。显示相应的输出设置。
- 设置文件名(Filename),默认为工程名。
- 选择可用的缩放尺寸,本例使用 1-6 较为合适。
- 设置中心点(Center)。该设置影响载入时默认的中心位置和缩放尺寸。手工输入坐标和点击图形均可,
- 设置边界(Bounds)。只有边界框内的数据会被输出。手工输入坐标或按住 SHIFT 拖拽均可。默认为全球范围。
- 点击 “Export” 执行。
- 完成后,进度条会变为保存(Save)按钮,点击保存至指定目录。
在菜单中选择 可以回到欢迎界面。
其它信息
除了以上演示的基本操作,TileMill 还有众多的功能:
- 在操作中随时可以点击
 获取帮助。
获取帮助。
- CartoCSS 语言 API 文档
- 学习如何 将 TileMill 作为 Ubuntu 环境下的服务