
Bemerkung
Das Projekt ist nur Teil der OSGeoLive Virtuelle Maschine Disk (VMDK)
uDig Quickstart
uDig (User Friendly Internet Desktop GIS) ist ein Desktop GIS-Client zum Anzeigen und Editieren von räumlichen Daten.
Dieser Quickstart beschreibt, wie Sie:
load a map layers from a shapefile and Web Map Service (WMS)
Verwenden der Standardwerkzeuge zum Navigieren in der Karte
Anpassen der Farbe für die Darstellung von Objekten (Stil)
Inhalt
uDig starten
im Startmenü des Desktops wählen
nach einem Moment wird die Anwendung gestartet und ein Begrüßungsbildschirm angezeigt
If you have any difficulties, or are running uDig please review the Running uDig reference page.
Willkommensansicht
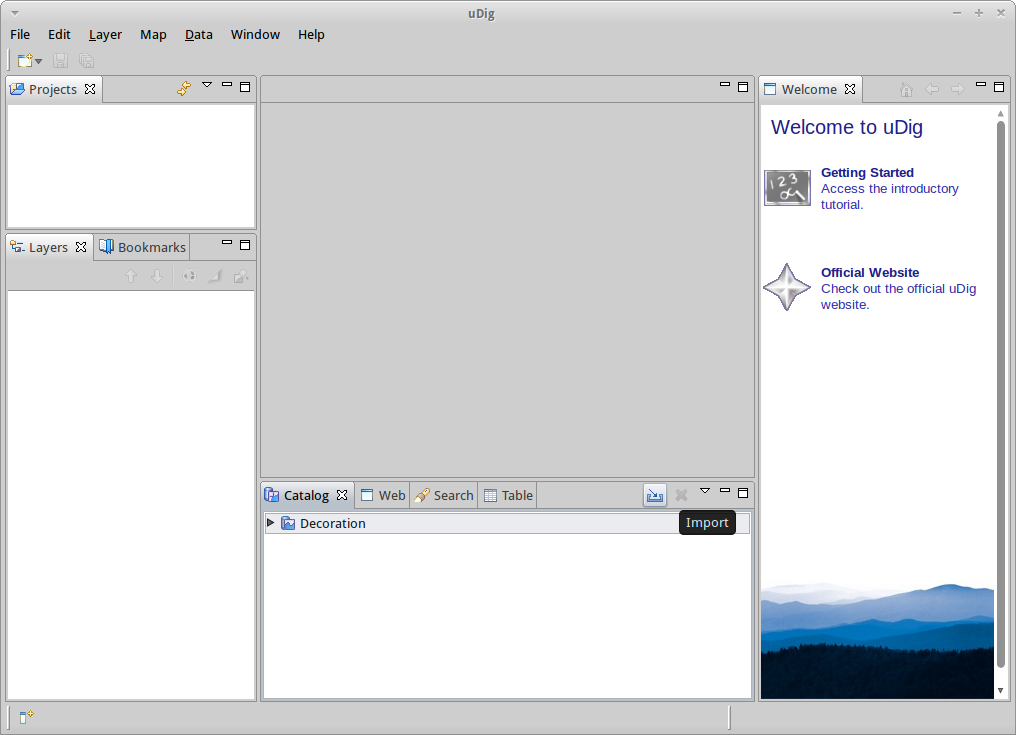
When you start up uDig for the first time the Welcome view takes up the entire display. This screen has links to tutorials, documentation and the project website.
Click the arrow labelled Workbench in the upper right corner, to reveal the contents of the uDig workbench.
Die Willkommensansicht können Sie jederzeit wieder herstellen, indem Sie im Applikationsmenü auswählen.
Arbeitsbereich
Im Arbeitsbereich gibt es einen Bereich für die Karten, der umgeben ist von Ansichten, die das Arbeiten mit der Karte unterstützen. Viele Ansichten zeigen dabei kontextbezogene Informationen zur aktuell geöffneten und ausgewählten Karte an.
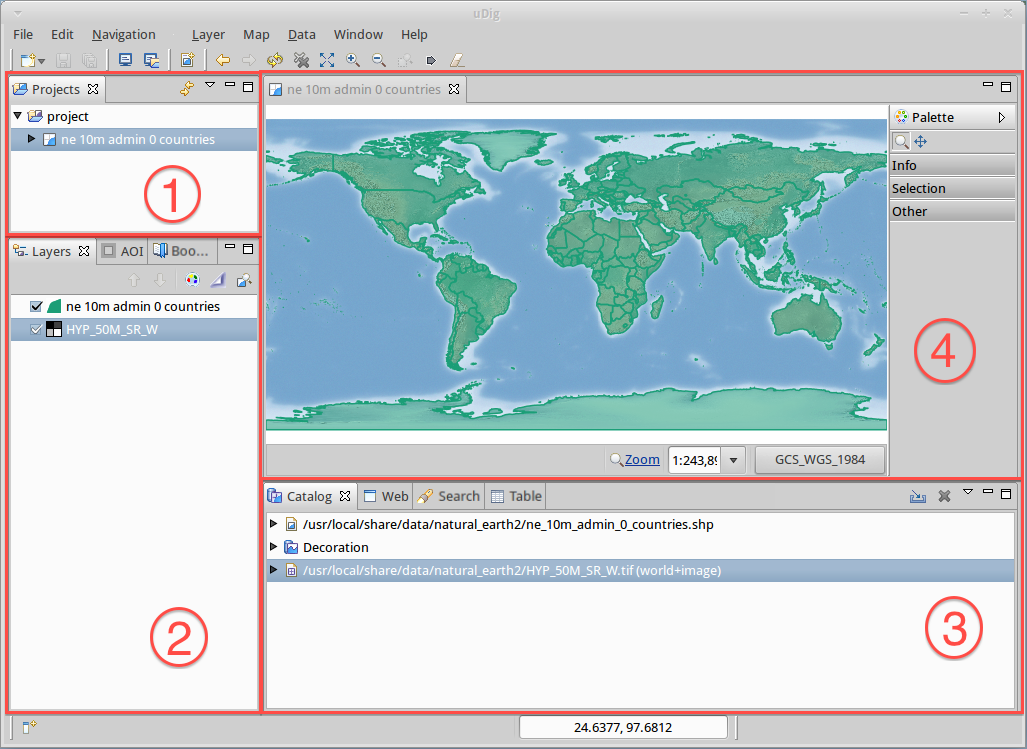
Oben ist ein typischer uDig -Arbeitsplatz mit Ansichten für die
Kartenlayer Layers (1),
Kartenprojekte Projects (2),
dem Katalog Catalog (3) sowie
der Karte (4)
zu sehen. Die Ansichten und deren Verwendung werden weiter unten beschrieben.
Dateien
Um einen ersten Eindruck der Anwendung zu gewinnen, werden wir Beispieldaten laden, die auf der DVD enthalten sind.
Wählen Sie vom Applikationsmenü. Es öffnet sich der Wizard Add Data.
Wählen Sie in der Liste der Datenquellentypen Files aus.
Klicken Sie auf die Schaltfläche Next. Es öffnet sich ein Dialog zur Auswahl von Dateien.
Die OSGeo-Live DVD enthält Beispieldaten im Ordner:
~/data(als Kurzform zu/usr/local/share/data)
Wählen Sie die folgende Datei aus dem Ordner
natural_earth2aus:ne_10m_admin_0_countries.shp
Klicken Sie auf die Schaltfläche Open
Eine neue Karte wird geöffnet, die den Inhalt des Shapefiles anzeigt. Der Name und die Projektion für die Karte wurden vom Shapefile übernommen (Standardverhalten)
Die Katalogansicht (Catalog view) wurde aktualisiert und enthält nun einen Eintrag für das Shapefile
ne_10m_admin_0_countries.shp. Diese Ansicht enthält als Liste alle Resourcen, die in den unterschiedlichsten Karten der uDig Anwendung verwendet werden.The Layers view shows a single layer is displayed on this map. This view is used to change the order and appearance of information in your Map.
The Projects view has been updated to show that your map is stored in projects > ne 10m admin 0 countries. You can have multiple projects open at a time, each project can have several maps.
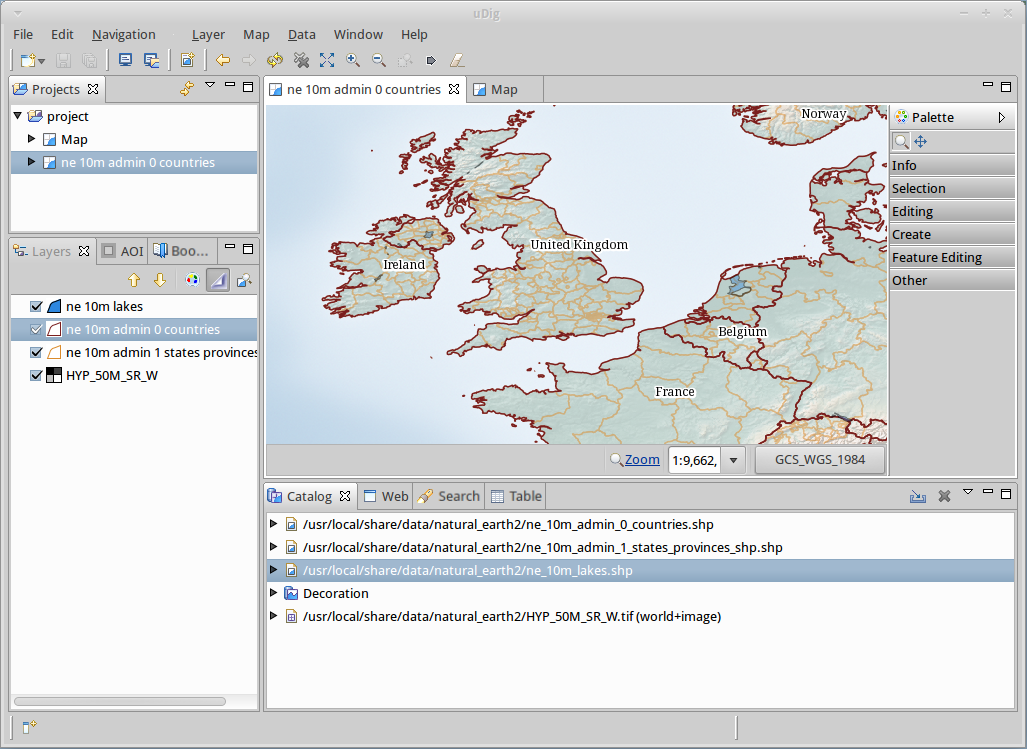
Open up the
~/data/natural_earth2/folder on the desktopDrag
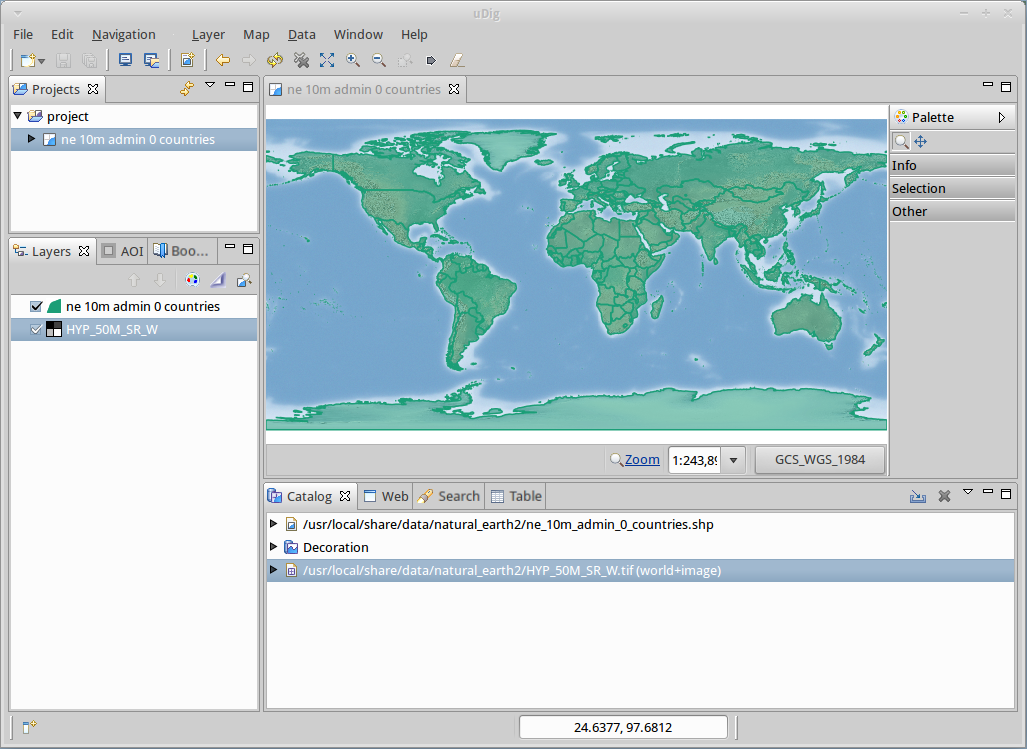
HYP_50M_SR_W.tifonto the Map Editor, a new layer is added to to the map.You can see the order the layers are drawn in the layer view. Right now the HYP_50M_SR_W layer is drawn on top of the ne 10m admin 0 countries layer.
Select the HYP_50M_SR_W layer in the catalog view and drag it to the bottom of the list
Bemerkung
One of the most common questions asked when uDig is considered for an organization is how much memory the application uses. Unlike most GIS applications uDig can get by with a fixed amount of memory. The above shapefile is not loaded into memory, we have a policy of keeping data on disk and drawing data like this shapefile onto the screen as needed.
Tipp
You can also drag and drop shapefiles directly into the uDig application!
Karte
You can control where in the world the Map Editor is looking by using the navigation tools in the tool bar along the top of the screen.
The
 Zoom tool is available by default
Use the zoom tool by drawing a box using the left mouse button around the area of the world you wish to see.
To zoom out draw a box with the right mouse button. The current map extents will be located within the box you draw.
The
 Pan tool can be used to scroll around your map with out changing scale.
There are also several navigation buttons that can be used at any time:
 Show All, can be used to return to the full extents at any time
 Zoom In and
  Zoom Out can be used to change the scale by a fixed amount.
You can use Navigation Back
 and Forward
  in the menu bar to cycle though previously
visited locations.
in the menu bar to cycle though previously
visited locations.
Tipp
Most tools allow you to Pan by holding the center button and control the scale using the scroll wheel.
Web Map Server
One of the reasons to use an application like uDig is to access all the great free geospatial information available on the web. This section covers the use of Web Map Servers which make available layers of information that you can mix into your own maps.
Bemerkung
If you are not connected to the Internet run for a local WMS. The script will open a page with a „Service Capabilities“ section and two links for WMS Services you can drag into your empty map.
Tipp
You can copy a WMS URL (e.g. for WMS 1.1.1) from right panel of GeoServer Welcome page and „paste“ it either on the Map view or the Layers view. A wizard shows you the layers you can add to the Map. You can also connect to Web Map Servers using the Add Data () Wizard and paste WMS URL right there.
Select from the menu bar
Change to the Web view, click on the tab next to the Catalog view to reveal the Web view.
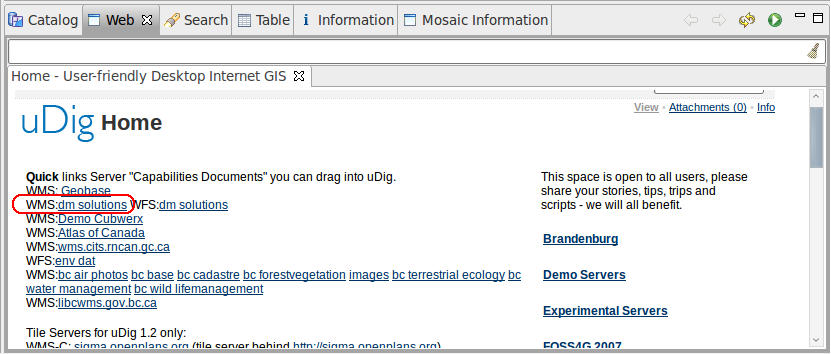
Klicken Sie auf den Link
WMS:http://www2.dmsolutions.ca/cgi-bin/mswms_gmap?Service=WMS&VERSION=1.1.0&REQUEST=GetCapabilities
From the Resource Selection page we are going to choose the following layers:
Elevation/Bathymetry
Parks
Cities

Press Finish to add these layers to your map
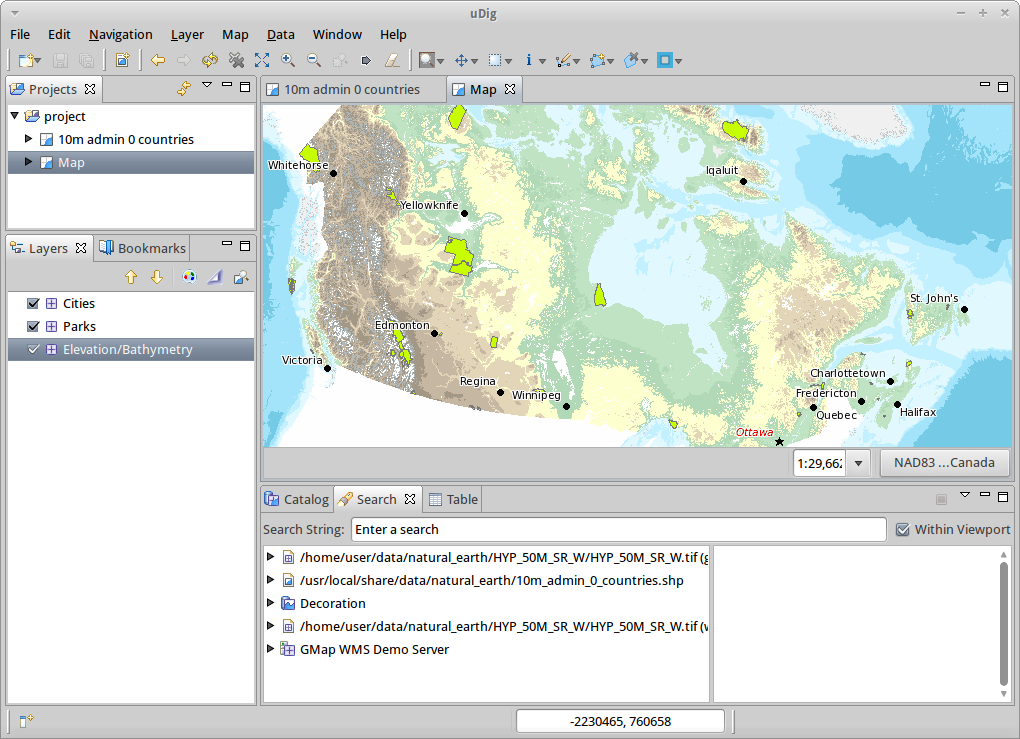
Use the
Zoom Tool to move closer to one of the ParksSwitch to the
 Info Tool and click on one the parks to learn more about it
Tipp
You can switch between the zoom and info tools by pressing Z and I on the keyboard.
Style
Select the project > ne 10m admin 0 countries, you can double click to open this Map, or Right Click and choose Open Map
Select the countries layer in the Layer view
Open up the Style Editor by right clicking on ne 10m admin 0 countries layer and choosing Change Style
We are going to change a few things about how countries are displayed
Line: Click Border, click on the Color button and change the color to BLACK
Fill: On Tab Fill uncheck the box enable/disable fill to turn off fill
Label: On Tab Labels check the box enable/disable labeling, and choose the attribute NAME from the list of attributes
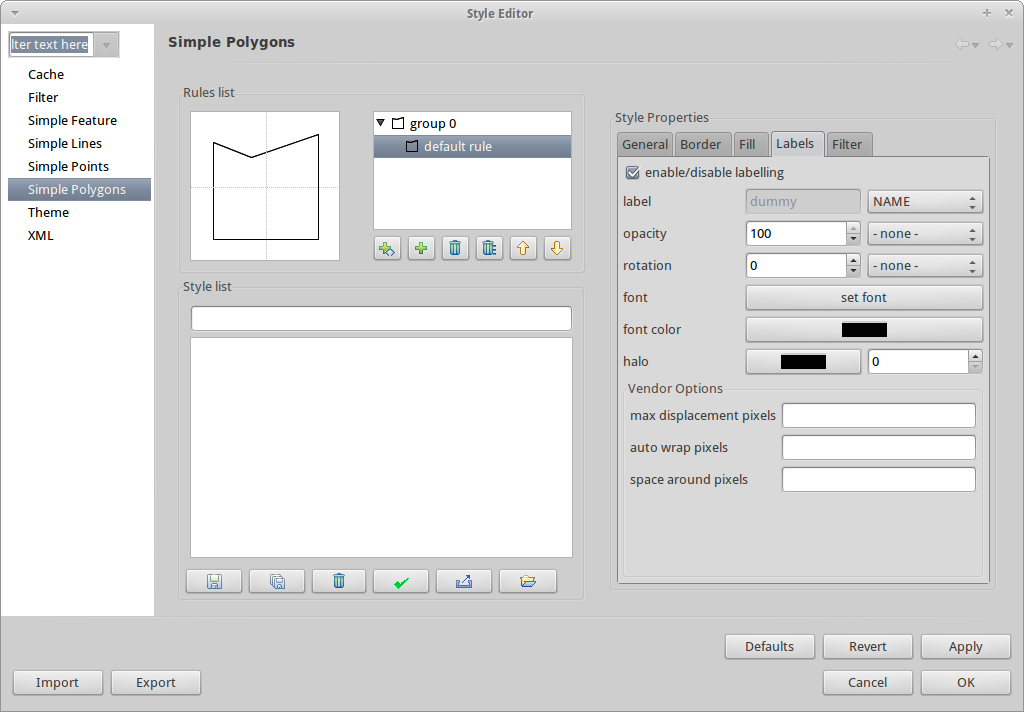
Press Apply to see what this looks like on your Map, the Layer view will also be updated to reflect the current style
When you are happy with the result you can press Close to dismiss the dialog
Bemerkung
Some files include style settings. The Style definition can be found in files with the *.sld extension. The name itself should be equal to the file containing the data. If such a Styled Layer Descriptor (SLD) file exists, the style will be applied automatically.
Sometimes it is a bit hard to see what is going on with layer providing much details. To get focused on the task you like to work on, you can choose from the menu bar. Using the Layer view select different layers in turn to see the effect. You can turn off this effect at any time using from the menu bar.
Weitere Aufgaben
Hier sind einige zusätzliche Herausforderungen für Sie zum Ausprobieren:
Try viewing your own GIS map layers, or try adding a layer from a Web Feature Service (WFS)
Try styling the WFS layer.
Was kommt als Nächstes?
This is only the first step on the road to using uDig. There is a lot more great material (and ability) left for you to discover in our walkthrough documents.
Walkthrough 1
Try out the use of PostGIS, extract data from a Web Feature Server and explore the use of Themes with our powerful Color Brewer technology.
/usr/local/share/udig/udig-docs/uDigWalkthrough 1.pdfWalkthrough 2 - Learn how to create shapefiles and use the Edit tools to manipulate feature data, covers the installation of GeoServer and editing with a Web Feature Server.
Available on http://udig.refractions.net/