

istSOS Quickstart
istSOS is an OGC Sensor Observation Service (SOS) server implementation written in Python. istSOS allows for managing and dispatch observations from monitoring sensors according to the Sensor Observation Service standard.
The project provides also a Graphical user Interface that allows for easing the daily operations and a RESTFull Web api for automatizing administration procedures.
istSOS is released under the GPLv2 licence, and runs on all major platforms (Windows, Linux, Mac OS X), even though it has been used in production in linux environment only.
Contenu
Create postgis database
Open a terminal and execute the following commands:
sudo -u postgres createdb -E UTF8 istsos
sudo -u postgres psql -d istsos -c 'CREATE EXTENSION postgis'
Set up an istSOS service instance
With istSOS you can organize your sensor data in different instances. Every instance has its own database schema independent from other instances. You can even deploy other databases over your network according to your needs.
The first steps into istSOS setup is to configure the default configuration options. These options will then be automatically used for your convenience by every new istSOS instance created.
Click to open the Web Admin interface. Alternatively, open a browser and go to http://localhost/istsos/admin
Click the Enter button in the administration page.
Configure your database connection. From the toolbar buttons menu, press the « Database » button and fill in the database configuration options:
user: postgres
password: postgres
host: localhost
port: 5432
DB name: istsos
Press the « Service provider » button and fill it using your institutional information.
Press the « Service identification » button and fill up with custom metadata that describe the service usage.
Press the « Coordinates system » button to manage the Coordinate Reference System (CRS).
Default EPSG code: this will be the native Coordinate Reference System of your geometries in the database.
Permitted EPSG: here you can configure which other Coordinate Reference Systems your system will support and reproject if requested.
From the toolbar buttons menu, press the « GetObservation Configuration » button to set maximum time interval per getObservation request (zero for no limits) and aggregation no-data value.
Configure your service proxy address. The Proxy URL field is the base URL seen beyond a reverse proxy.
Create a new service
Now that you have configured istSOS, it’s time to create a new service instance.
From the toolbar buttons menu press the « new service » button and click Next.
Type demo for the Service name.
In the EPSG field you can set the database native projection. Leave it empty to use the default. Click Next.
Clicking on the « Customize database » box, you are able to change the default database configuration for this new istSOS instance.
Press Next. The server status panel is displayed. If something’s gone wrong during the creation you will see an alert here.
Note
The istSOS “demo” instance has inherited all the configuration options from the default configuration. If, for any reason you decide to modify them, the changes will affect only this instance.
Add a new procedure
From the “services” drop down button of the admin interface (http://localhost/istsos/admin ) choose the desired instance.
From the toolbar buttons menu press the New procedure button.
Fill in the form using appropriate information.
Avertissement
Once a procedure is created the outputs (observed properties) cannot be changed.
Note
Optional parameters: Fill at your own need and willing
Example (minimal configuration)
Name: T_LUGANO |
Description: temperature weather station in Lugano |
Keywords: weather, meteorological, IST |
System type: insitu-fixed-point |
Sensor type: PTC thermistors of the « switching » type |
FOI name: LUGANO |
EPSG: 4326 |
Coordinates: x: 8.96127 y: 46.02723 z: 344.1 |
Outputs (confirm the outputs pressing the « add » button):
Observed property: urn:ogc:def:parameter:x-istsos:1.0:meteo:air:temperature |
Unit of measure: °C |
Description (optional): conversion from resistance to tempera |
quality index check (optional): Between / from -40 to +60 |
Note
Register the new sensor (procedure) pressing the « submit » button.
Add new observations
First we will create a text file with sensor data, formatted according to « text/csv, subtype=istSOS ». The file uses a Comma Separated Values (CSV) format. The first line contains header information, including URI names of the observed properties. The following lines contain the data.
Open a text editor by selecting .
Copy and paste the following text into the text editor window:
urn:ogc:def:parameter:x-istsos:1.0:time:iso8601,urn:ogc:def:parameter:x-istsos:1.0:meteo:air:temperature
2014-06-03T14:30:00.00Z,22.20
2014-06-03T14:40:00.00Z,22.00
2014-06-03T14:50:00.00Z,21.70
2014-06-03T15:00:00.00Z,21.20
2014-06-03T15:10:00.00Z,20.70
2014-06-03T15:20:00.00Z,20.20
2014-06-03T15:30:00.00Z,19.60
2014-06-03T15:40:00.00Z,19.20
2014-06-03T15:50:00.00Z,18.20
2014-06-03T16:00:00.00Z,18.00
2014-06-03T16:10:00.00Z,17.20
Save the file as « T_LUGANO_20140603161000000.dat » on the Desktop. The filename convention being used is: PROCEDURENAME_YYYYMMDDhhmmssfff.dat
Open a terminal by selecting .
In the terminal, enter: « cd /usr/share/istsos/ » and press ENTER.
Write « python scripts/csv2istsos.py -p T_LUGANO -u http://localhost/istsos -s demo -w ~/Desktop » and press ENTER
You should see a message « Insert observation success: True »
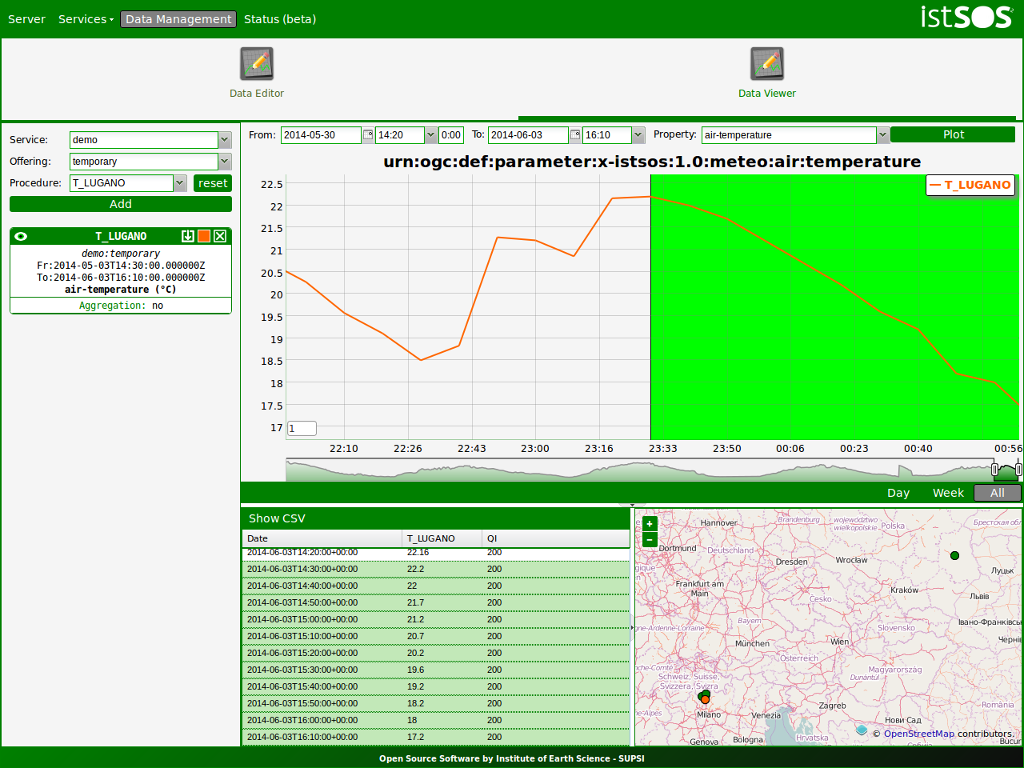
Click .
Click the Enter button in the administration page
Click .
- Select the following:
Service = demo
Offering = temporary
Procedure T_LUGANO
Click the Add button
Click the Plot button and check that the data have been added (watch out at your time zone!)
Ensuite ?
To learn more about istSOS, a starting point is the istSOS Documentation and the istSOS Tutorial.