

QGIS Quickstart
QGIS is a user-friendly Desktop GIS client which lets you visualize, manage, edit, analyse data and compose printable maps.
Contents
Start QGIS
Open the ‘Desktop GIS’ folder.
Double click on the ‘QGIS’ icon.
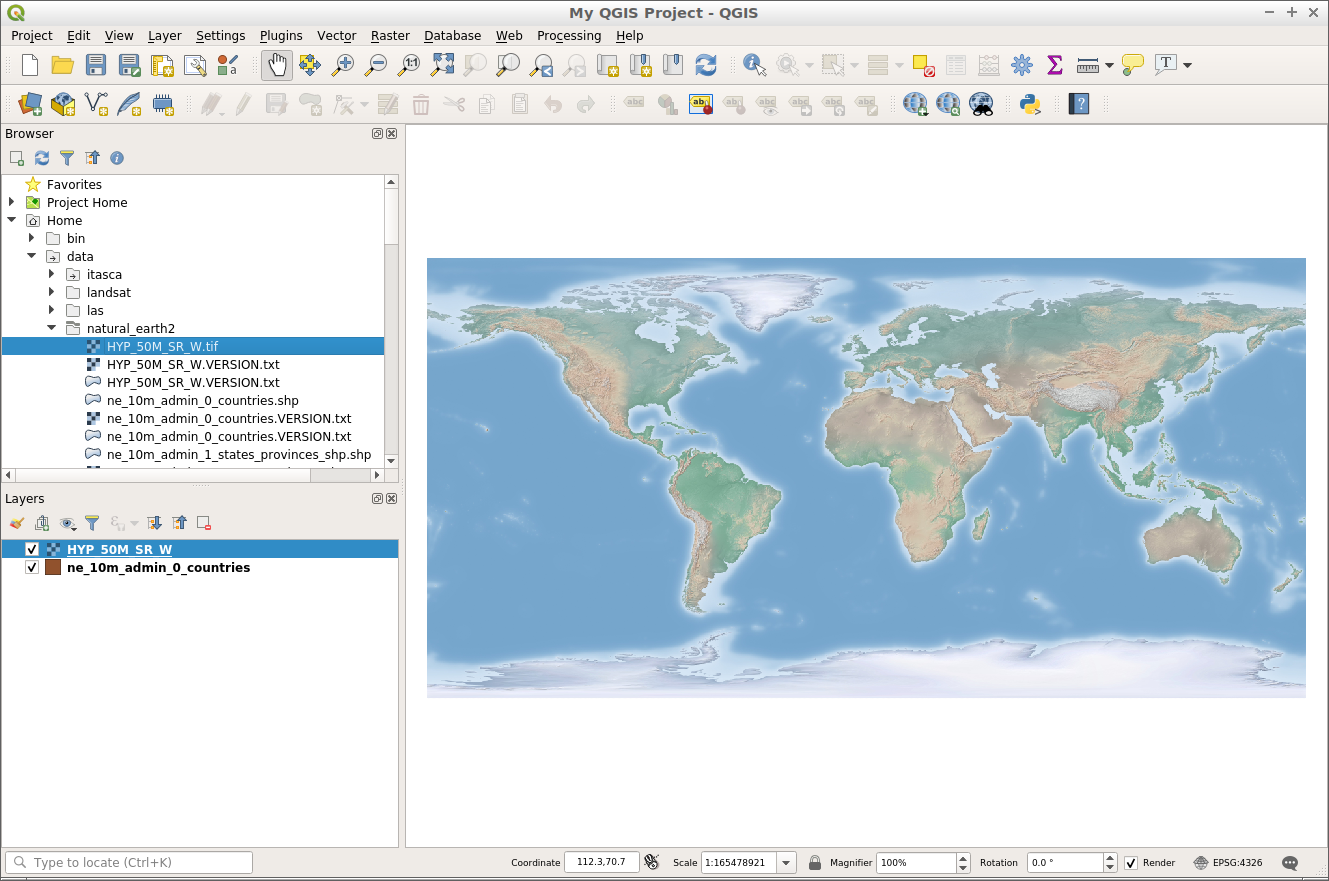
You will see QGIS launch with an empty project. The various parts of the QGIS Interface are listed below.
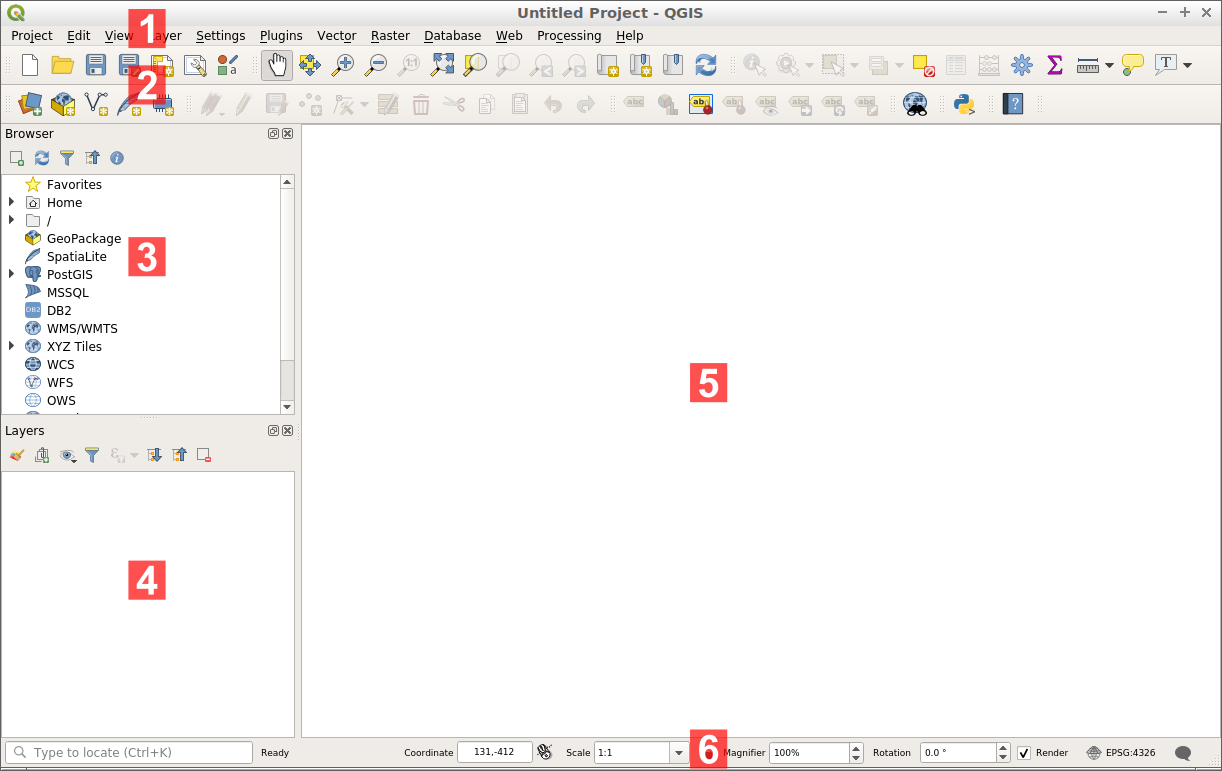
[1] Menu bar: Access to various QGIS features using a standard hierarchical menu.
[2] Toolbars: For interaction with the map, layers, attributes and selections.
[3] Browser Panel: A spatial file browser allowing drag and drop content into the map frame.
[4] Layer Panel: Controls the map layers, their order, and visibility.
[5] Status Bar: General information about the map and access to a universal search bar.
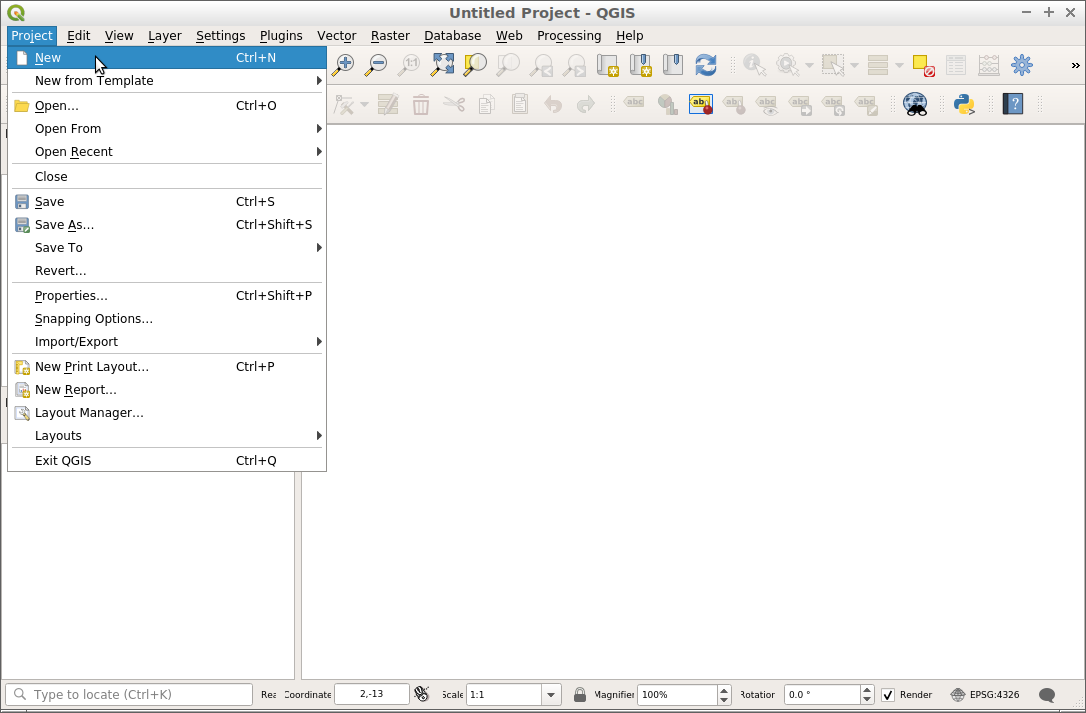
Create a project
To create a new project, choose .
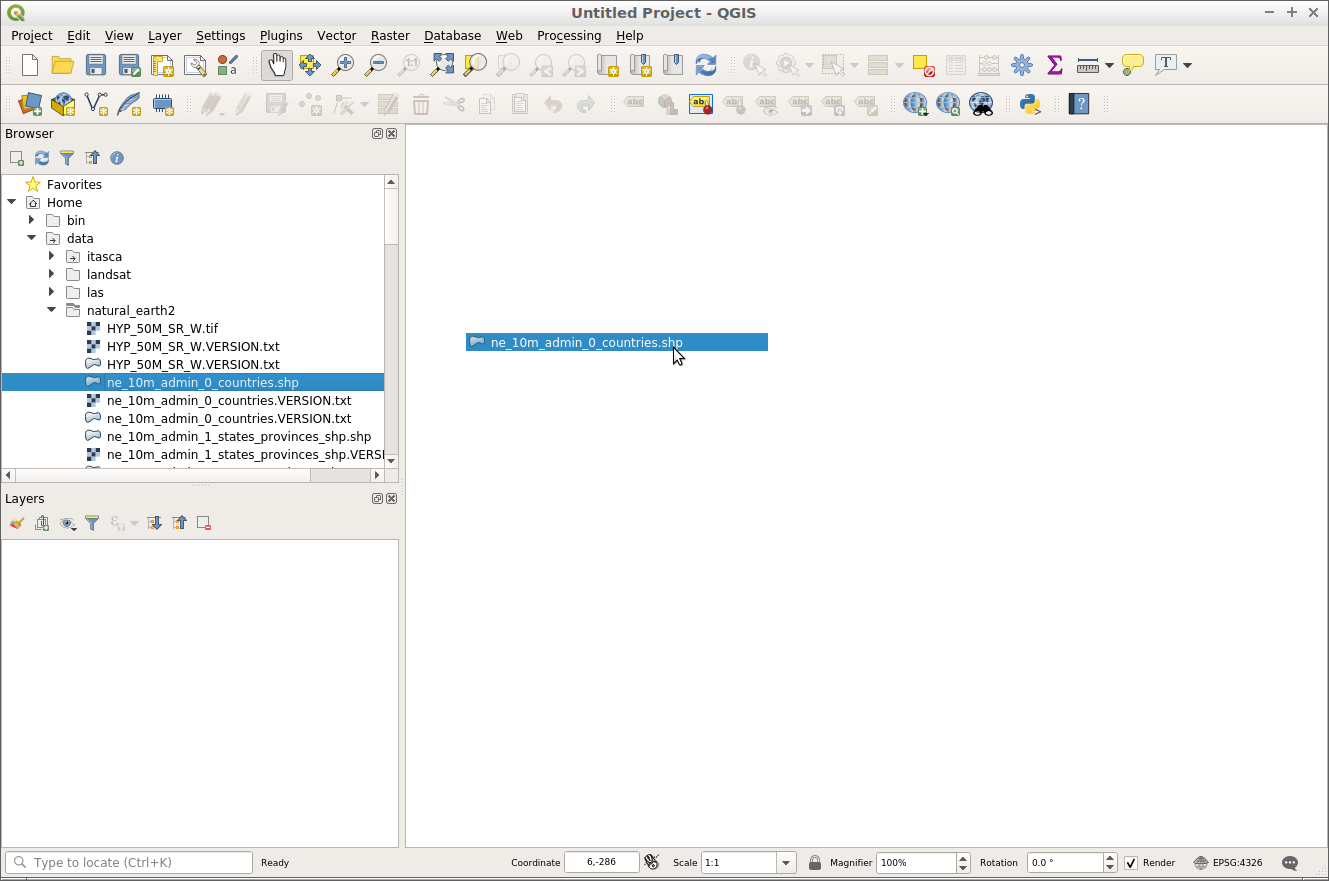
Let’s start by adding a vector layer to the map. Layers can be added to QGIS using the browser panel, located on the left of the screen.
Go the browser panel on the left of the screen.
Navigate the folder tree to ‘home/data/natural_earth2’.
Select ‘ne_10m_admin_0_countries.shp’.
Drag the layer from the browser panel and drop it in the map frame.
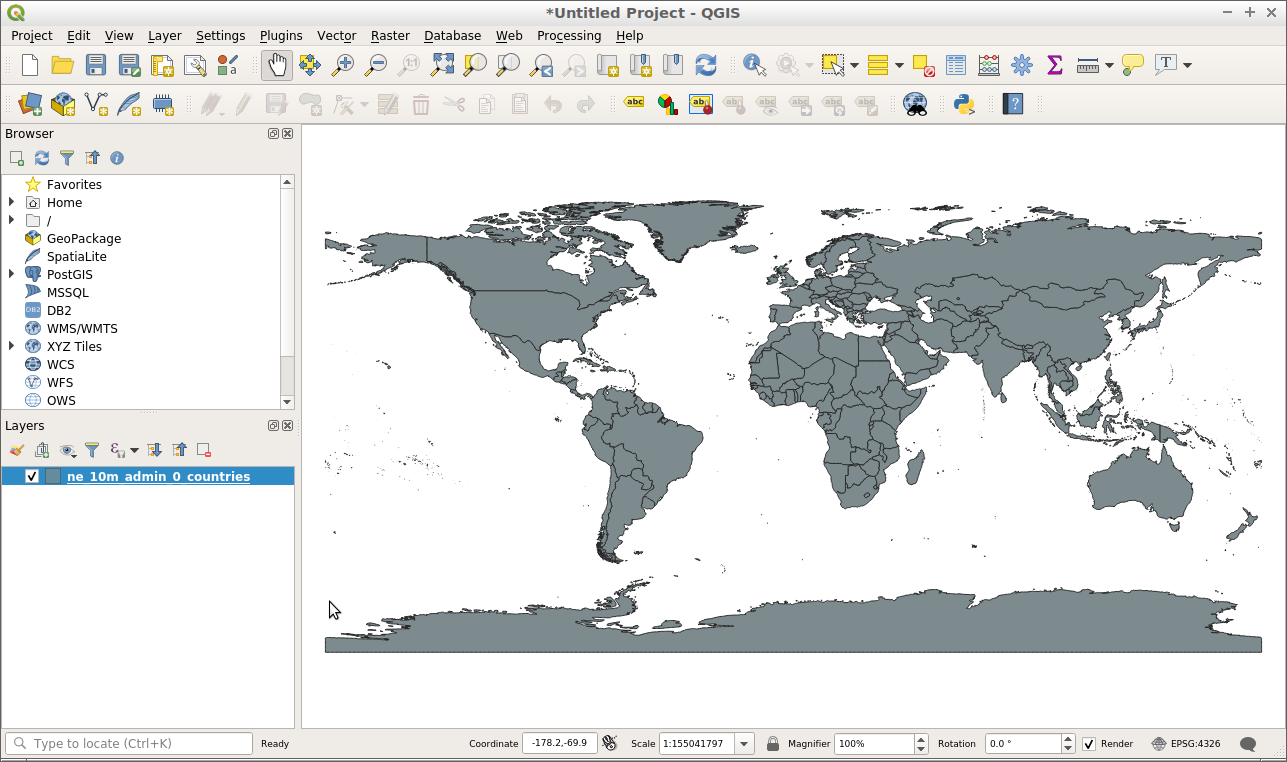
Once the layer has been dragged onto the map frame, you will see a layer showing countries.
Now let’s try adding a raster layer to the project.
Go the browser panel on the left of the screen.
Navigate the folder tree to ‘home/data/natural_earth2’.
Select ‘HYP_50M_SR_W.tif’.
Drag the layer from the browser panel and drop it in the map frame.
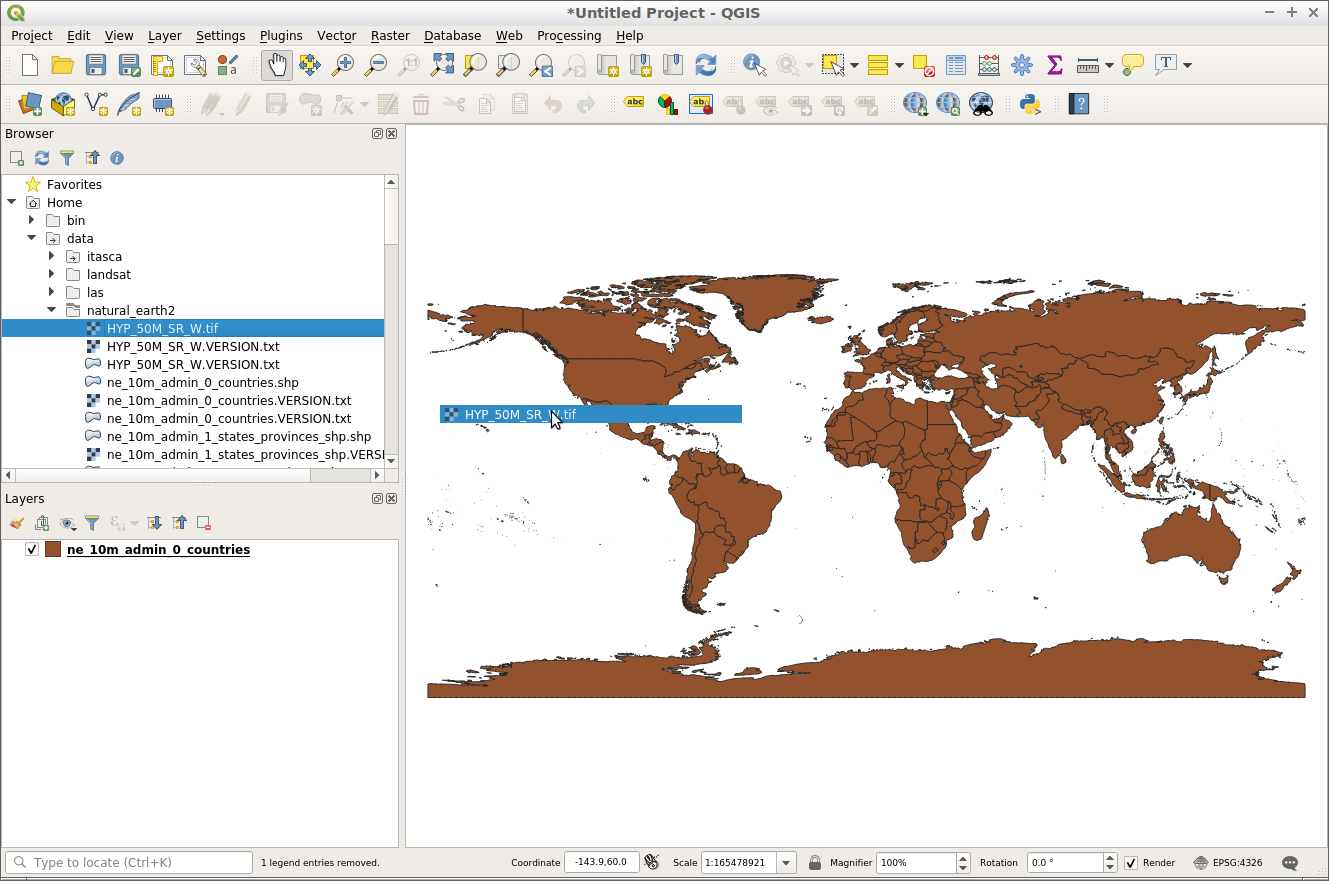
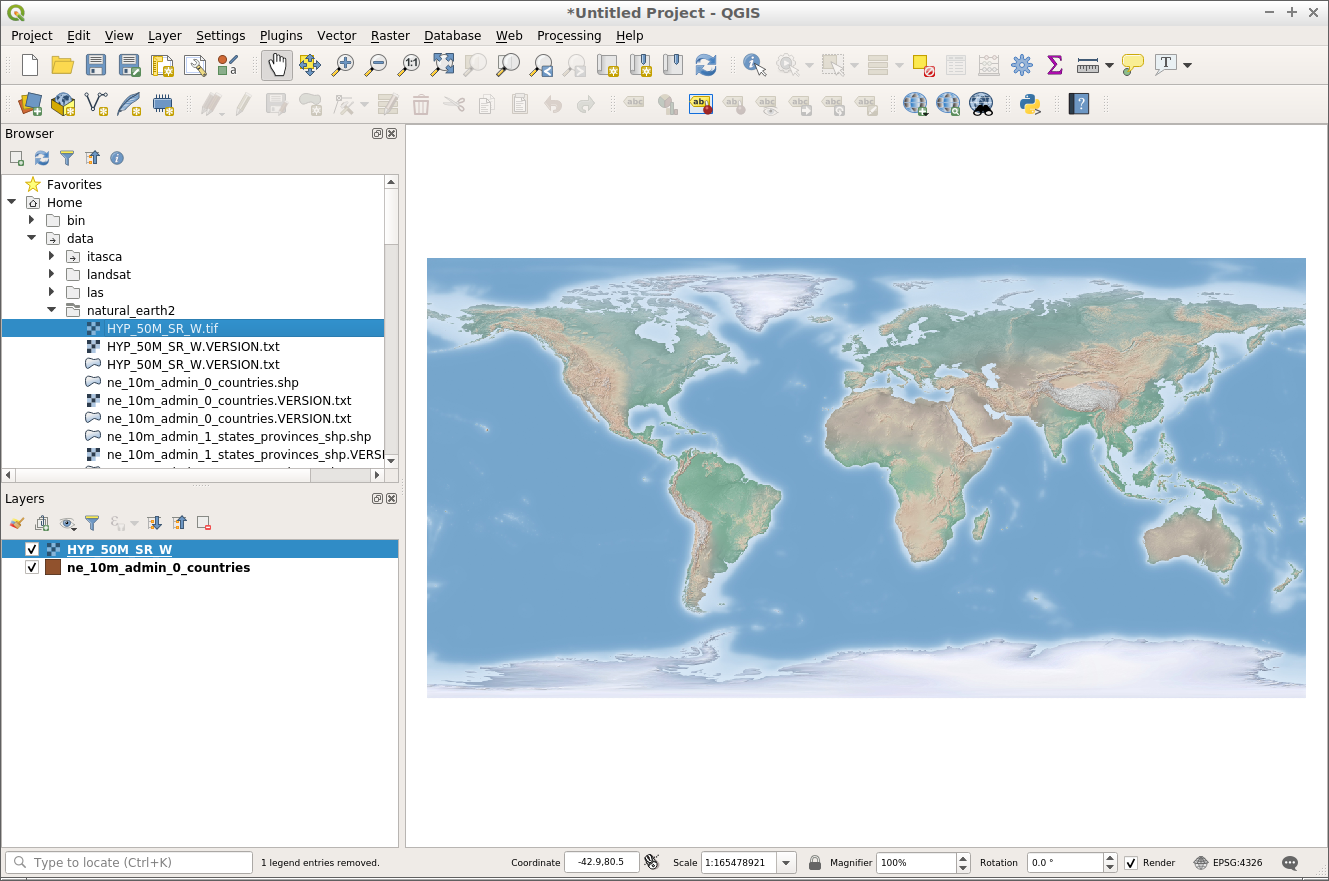
Once the layer has been dragged onto the map frame, you will see a raster layer showing land cover and bathymetry.
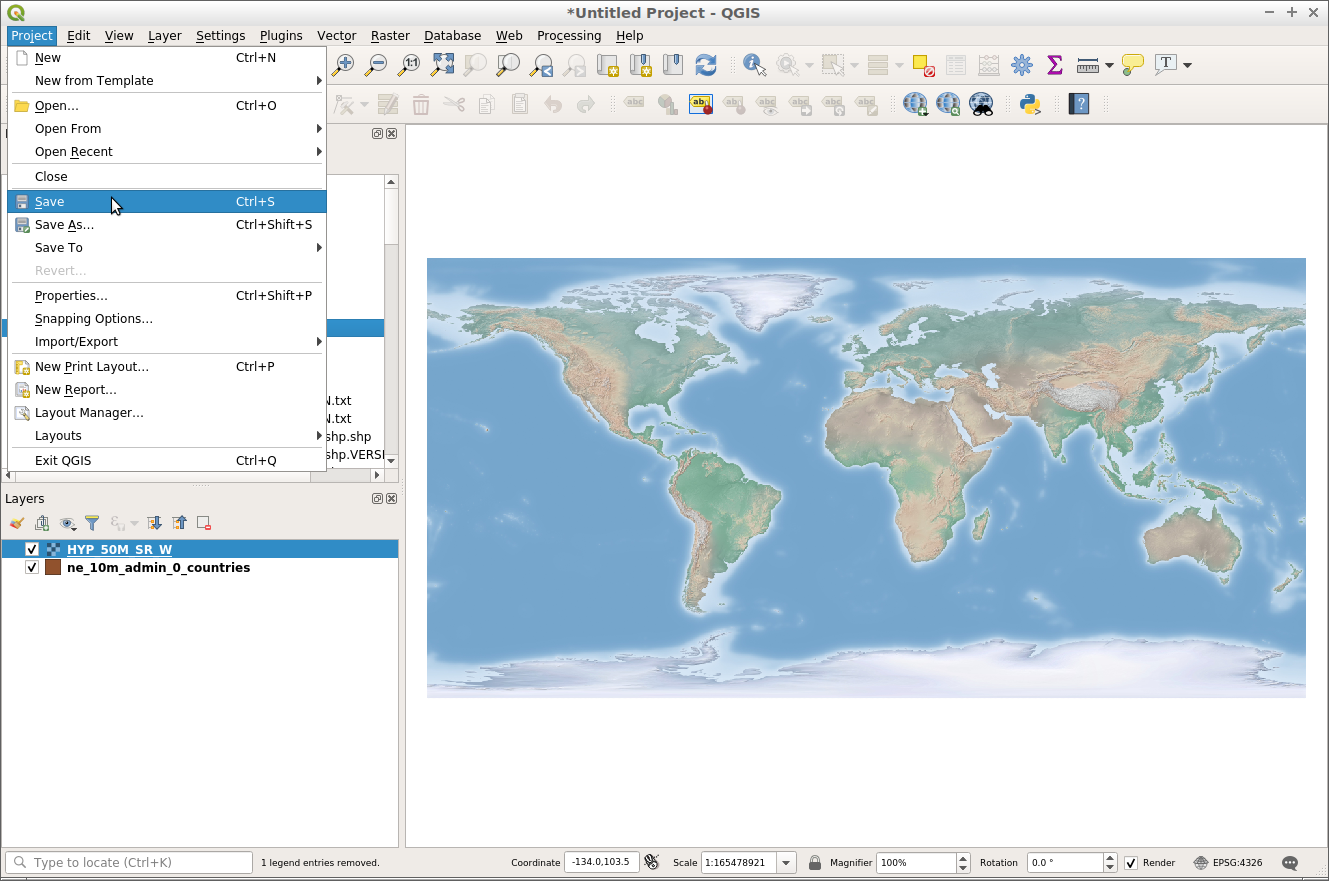
Now that we have added some content to our project we can save this project so that we can come back to it at a later time.
Choose .
Make the location to save the project ‘/home/user/desktop’.
Call the project ‘My QGIS project’.
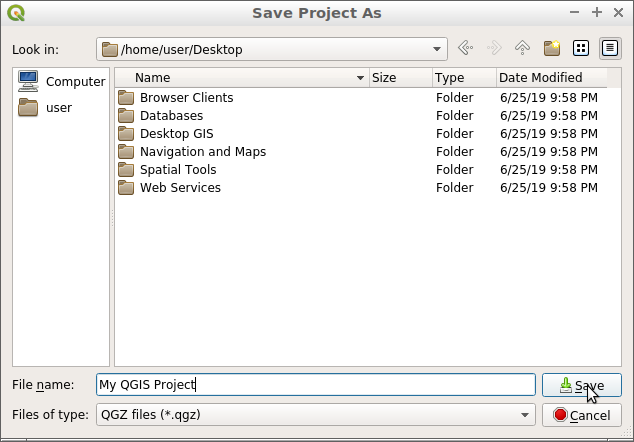
Click ‘Save’.
You will know the project has been saved because there will be a project file on the desktop called ‘My QGIS project’ and the top of your project document will no longer read as ‘untitled’ but instead will read as ‘My QGIS project’.
Open an existing project
A QGIS project saves layers, styles, map extents and settings for use at a later time. This information is stored as a QGIS project file and has an extension of ‘.qgs’ or ‘.qgz’, with ‘.qgz’ being the default file format in QGIS going into the future.
Let’s open an existing QGIS project and have a look at how it works.
Open QGIS. Note that when QGIS is opened you will be presented with a list of recent projects to chose from. This is a convenient way to open a project you have used recently.
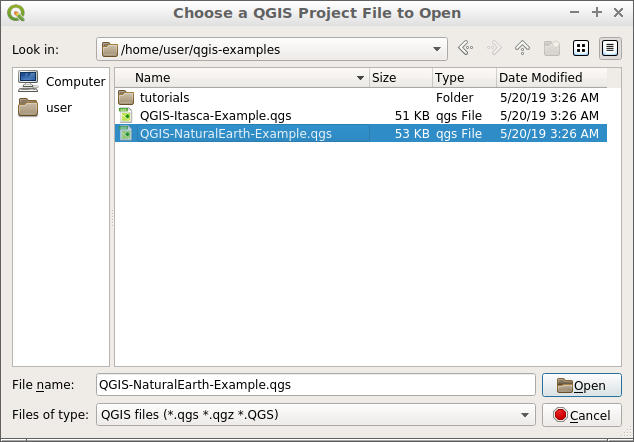
Choose .
Navigate to ‘/home/user/qgis-example’.
Select the project ‘QGIS-NaturalEarth-Example.qgs’.
Click ‘Open’.
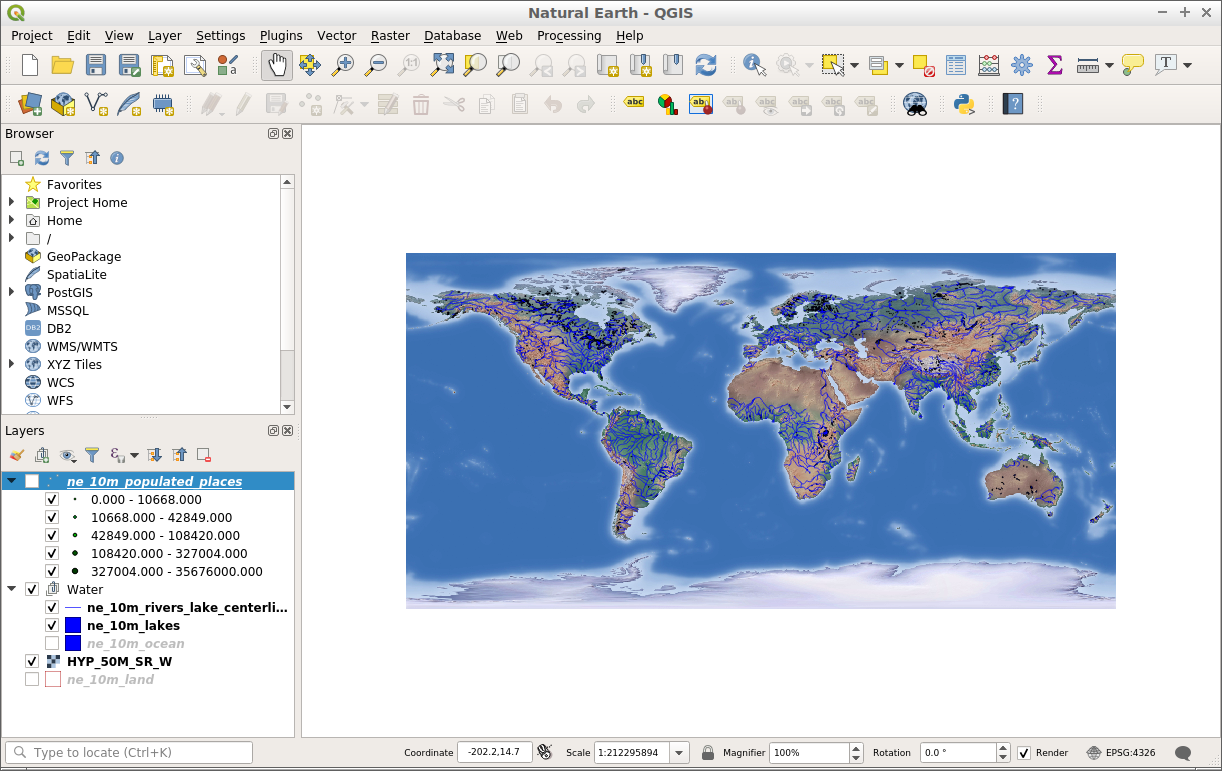
This will open a QGIS project with a number of Natural Earth datasets, as shown below. This project contains a number of layers in the layers panel and is displaying the spatial content in the map frame.
Layers can be turned on or off by clicking the checkbox next to the layer name in the layers panel. When a layer is turned on in the layer panel, the map frame will be updated to display the layer. A close up of the layer panel is shown below.
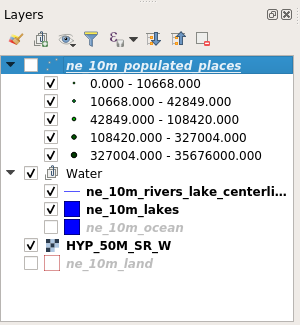
Let’s interact with the layer panel and change the visibility of some map layers.
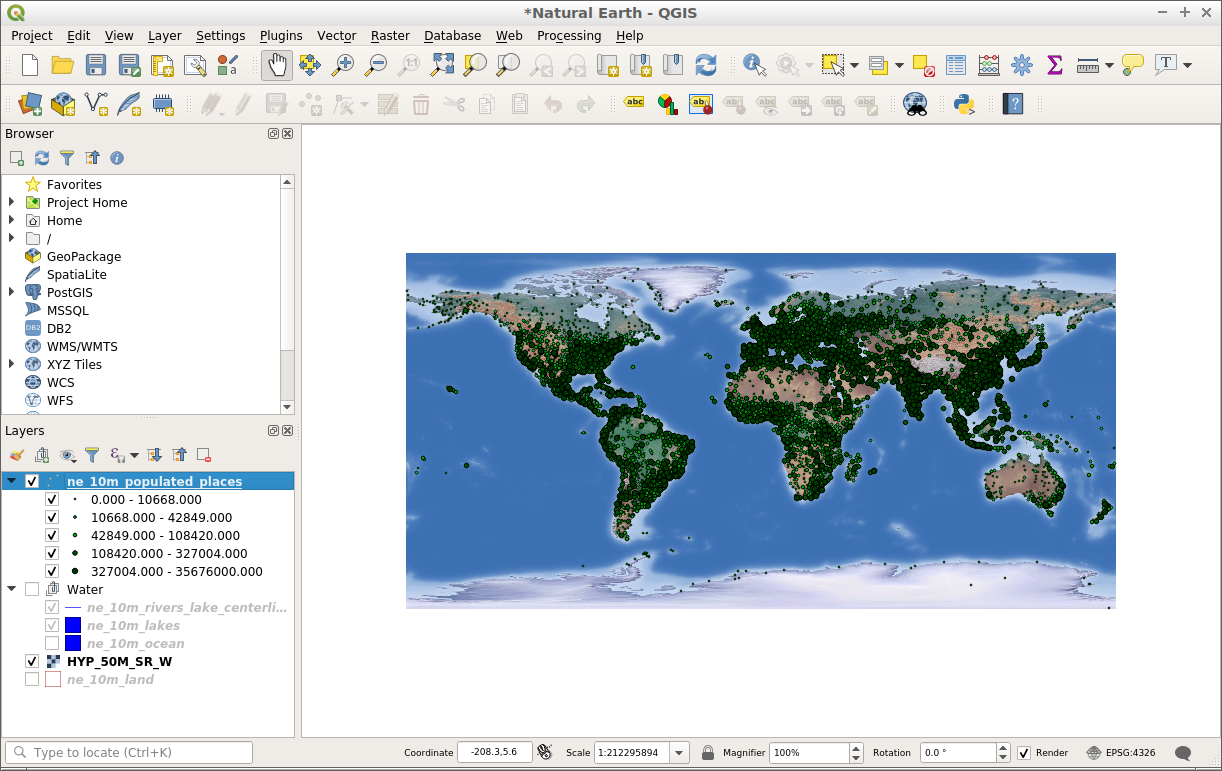
Click the checkbox next to the ‘ne_10m_populated_places’ layer to turn it on.
Click the checkbox next to the ‘Water’ layer to turn the layer off.
Notice how the map frame has been updated to reflect the changes in the layer list. We can now see the ‘ne_10m_populated_places’ layer as points, but can no longer see the rivers and lakes which are within the ‘Waters’ layer.
In addition to controlling layer visibility, we can also change the order in which layers are drawn in the layer panel. This is done by selecting a layer in the layer panel and dragging it up or down the list. The order that the layers appear in the layer list is the order which they will draw on in the map frame.
Left-Click on the layer ‘HYP_50M_SR_W’.
While holding the mouse button down drag the layer to the top of the list.
Notice how the raster layer is now on top of all other layers in the layer panel. This now renders the raster layer on top of all other layers in the map frame.
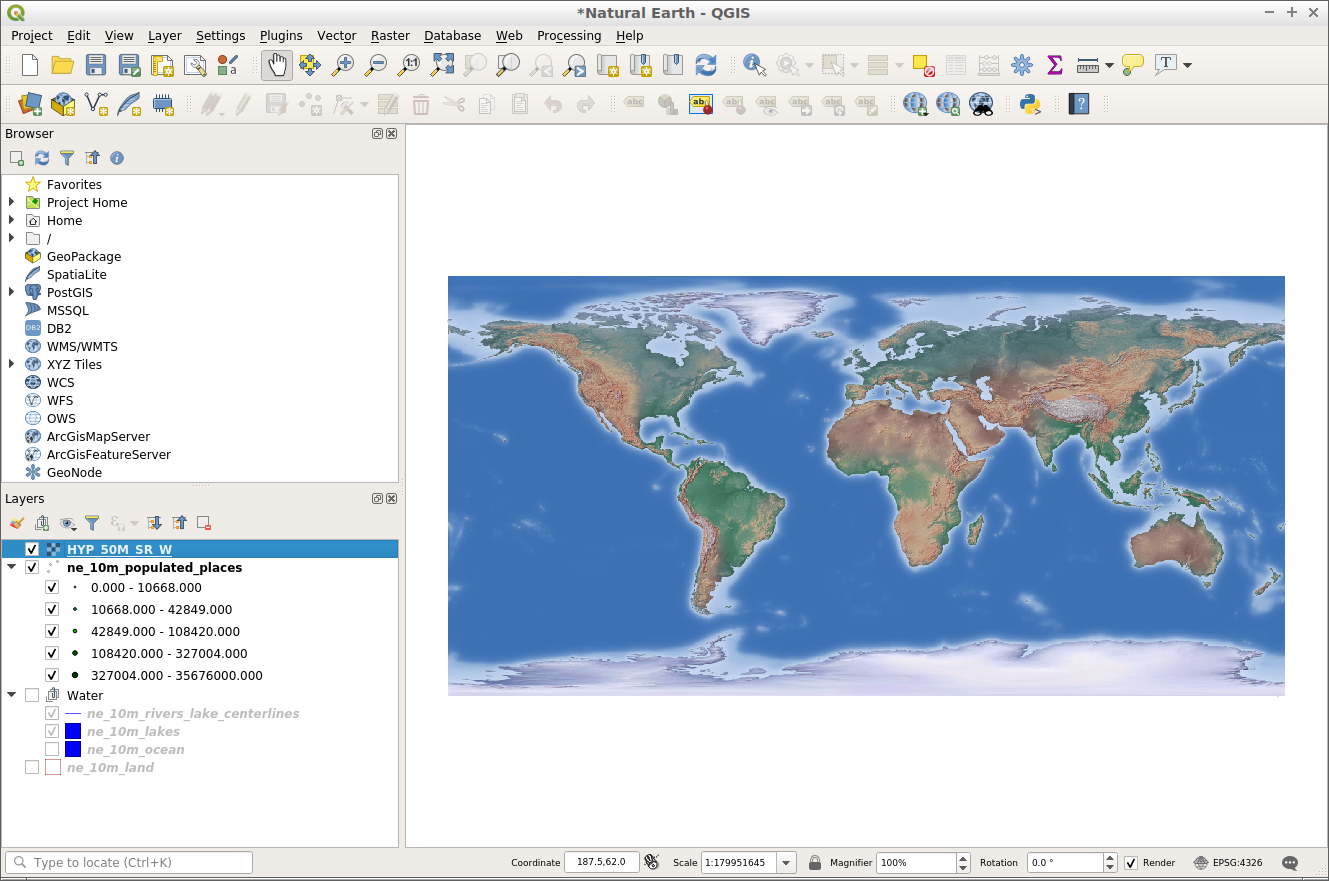
Try moving the ‘HYP_50M_SR_W’ layer to the bottom of the layer list. This would be a more appropriate position for a map layer like this.
Navigate the map
The navigation toolbar allows users to move around the map and change the map extent.
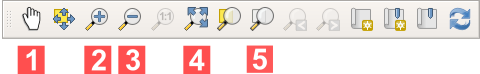
[1] Pan: Allows the map to be dragged (‘panned’) to a new location.
[2] Zoom in: Allows the map extent to be zoomed in.
[3] Zoom out: Allows the map to be zoomed out.
[4] Zoom to full extent: Changes the map extent to fit all of the map layers into the map frame.
[5] Zoom to layer: Changes the map extent to fit the extent of the layer highlighted in the layer panel.
Let’s try changing the map extent with the zoom-in tool.
Select the ‘Zoom in’ tool from the navigation toolbar.
Move the cursor over the map frame.
Click and hold the left mouse button.
While still holding the mouse button move the cursor diagonally in any direction. Notice this draws a rectangle which is the area that will be zoomed to.
Release the mouse button when happy with the area created.
Note
The process of using the zoom out tool is the same as the zoom-in tool. The result is just the opposite.
Now, let’s look at the zoom to full extent tool. This tool will zoom the map out to an extent that will fit in all the layers in the map. To use this tool, click on the ‘Zoom to full extent’ button.
Finally, try the zoom to layer tool. To use this tool follow these steps:
Click on a layer name in the layer panel.
Click on the ‘Zoom to layer’ button.
The map should zoom to the extent of the selected (‘active’) layer.
Style your layers
Layers can be styled in QGIS using the style dock. The style dock is not visible by default, but easily accessible via a button at the top of the layer panel as shown below.
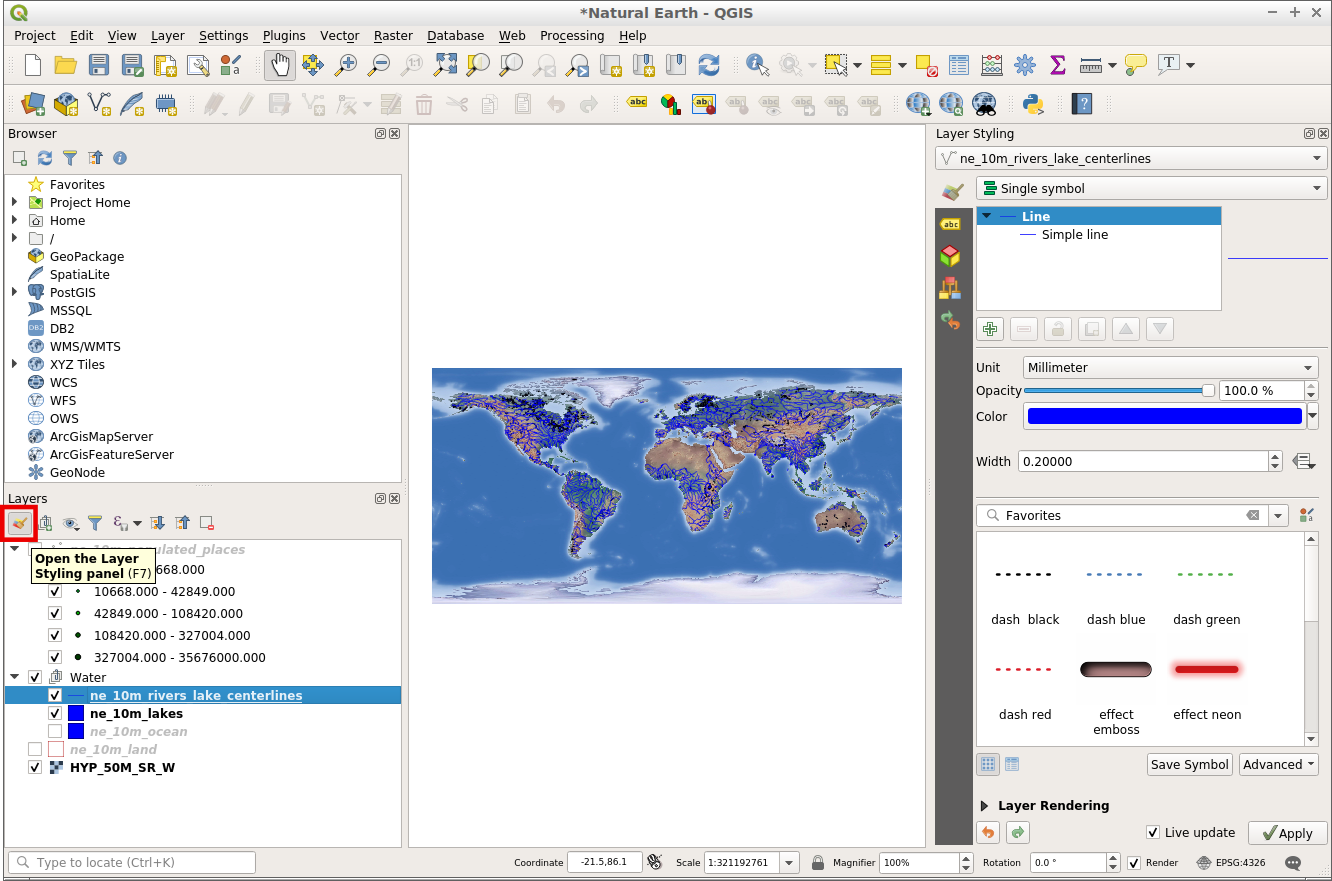
The above button acts as a toggle so the style dock can be easily hidden from view by clicking the same button again. When the style dock is enabled it will appear on the right-hand side of the screen ready to style the active layer highlighted in the layer panel.
With the style dock open, we can modify the appearance of the layer shown at the top of the style dock.
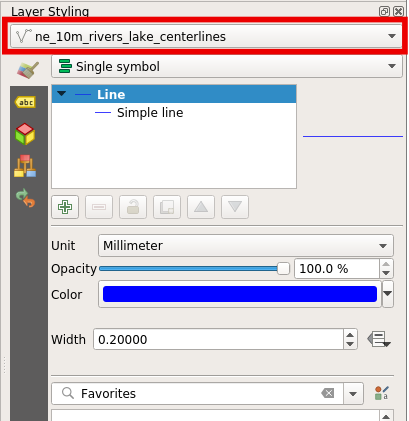
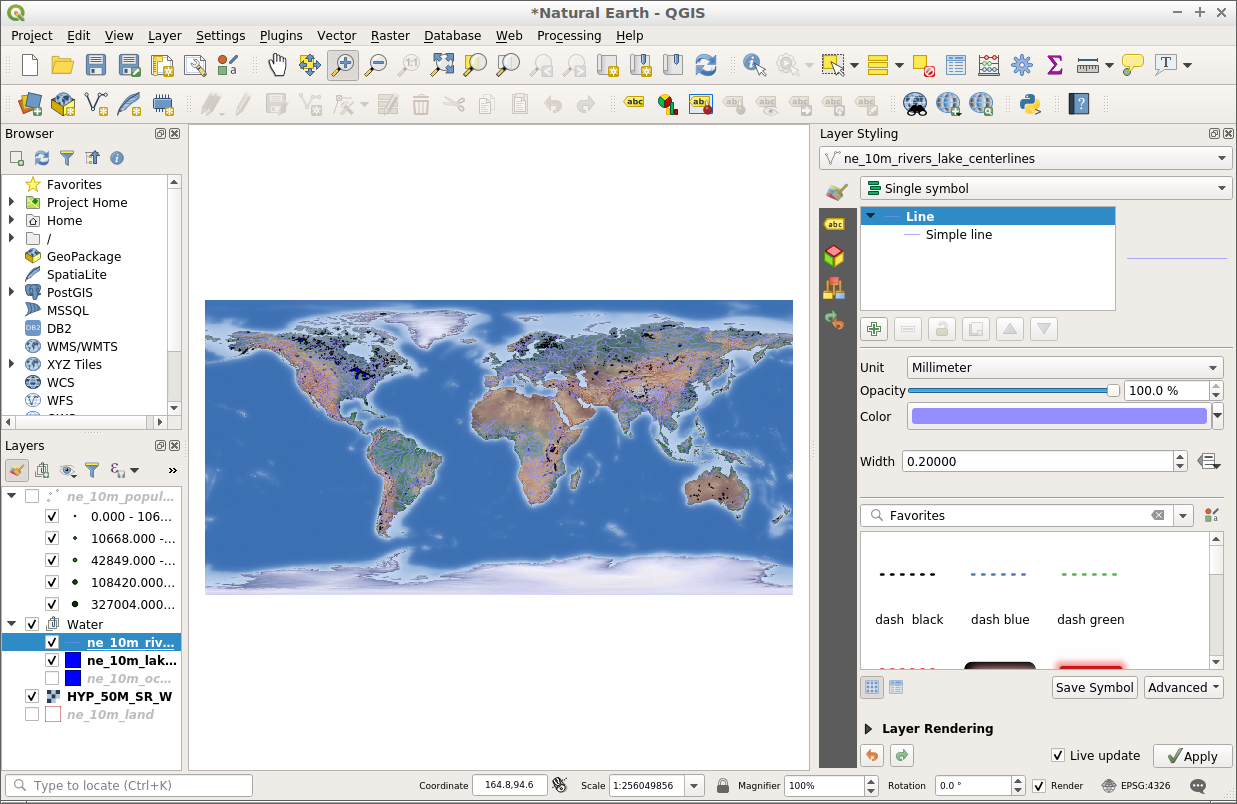
With the style dock now open, we can modify the colour and the width of the lines in the ‘ne_10m_rivers_lakes_centrelines’ layer. Let’s try modifying the colour first.
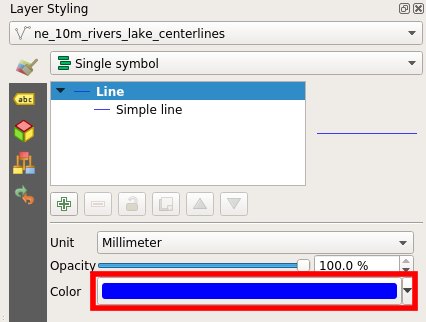
Click on the ‘Color’ swatch shown below. This will launch a colour palette allowing you to choose a different colour.
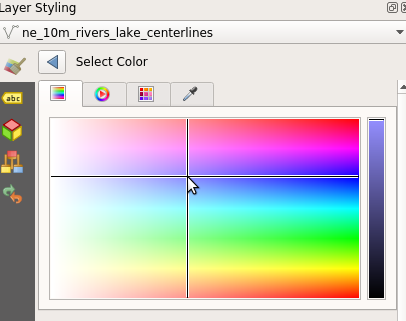
In the ‘Select Color’ palette, move the cross-hair to your preferred colour.
Then click the back arrow to return to the symbol render preview.
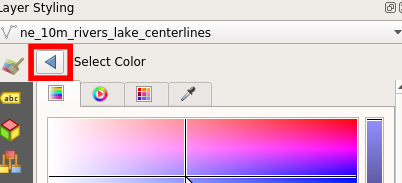
The symbol preview will be updated with the new colour, and so will the layer in the map frame.
In the style dock, we can also modify the size of the map features. To modify the thickness of the lines follow these steps:
Make sure that the ‘ne_10m_rivers_lakes_centrelines’ is selected at the top of the style panel.
In the style panel enter the value ‘0.5’ in the ‘width’ input.
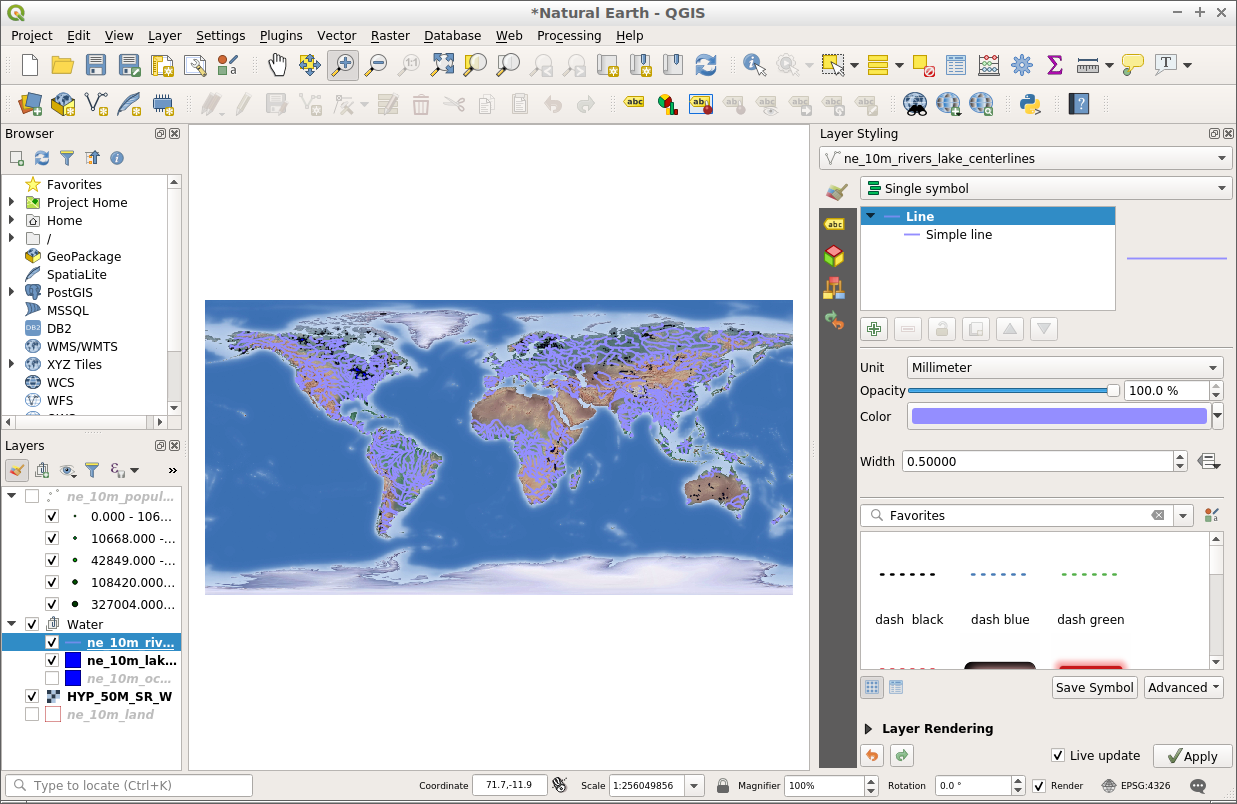
Notice the line in the symbol preview increase in width, and so do the lines that are in the map frame.
Things to try
Extend QGIS functionality with Plugins.
Start manipulating data with the Processing toolbox.
Use QGIS to view content from a PostGIS database.
Try publishing your QGIS map to the web using QGIS Map Server. in the
What next?
To learn more about QGIS, a good starting point is the Documentation page on the QGIS homepage and A Gentle Introduction to GIS eBook.