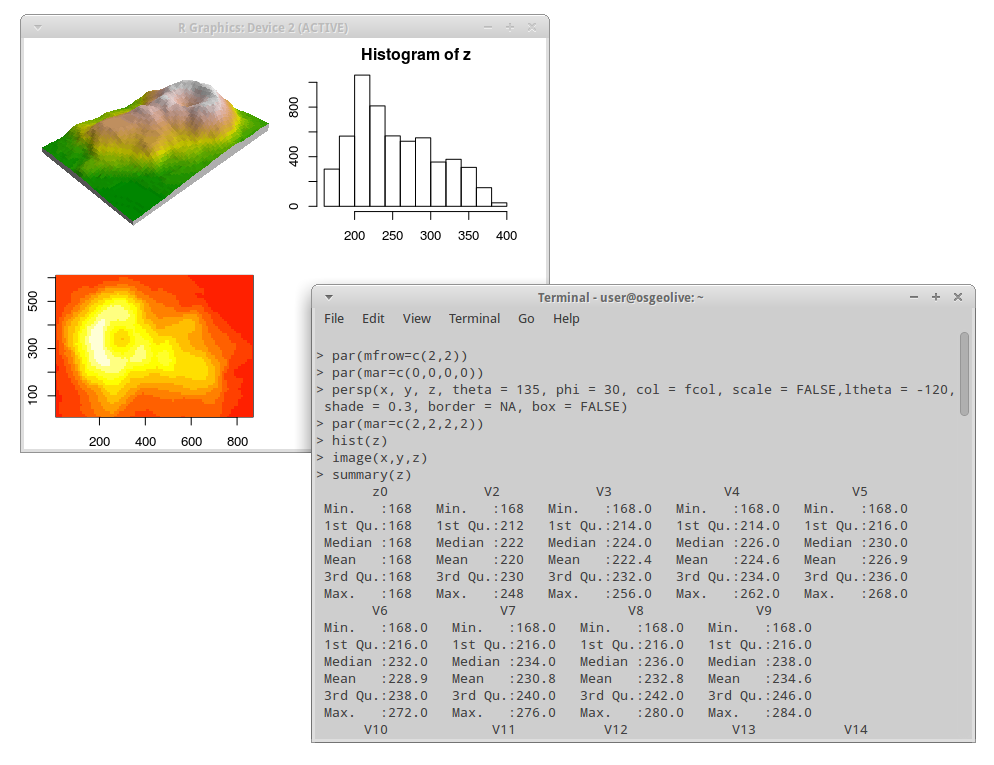
R is a powerful, widely used software environment for statistical computing and graphics which excels at analyzing and processing geographic data sets. Geospatial analysis capabilities within R are available in R packages (modules that extend the capabilities of R) that provide access to a large number of traditional and state of the art algorithms, often before they are available in other open source or proprietary software. R and its packages are able to process point, line, polygon and grid data. Users can accomplish a broad array of tasks such as: image classification, statistical analysis to infer spatial relationships and patterns of features, and others listed in the core features below. The functions available via R complement and advance capabilities found in GIS and image processing software.
The core R interface is a command line window which provides excellent flexibility and control but tends to lengthen the time required to become a proficient user when compared to software with a graphical user interface (GUI). Fortunately R is well documented on the web site which eases the learning process. Scripts are often used to automate processing steps but there are GUIs, the leading one being RStudio (http://www.rstudio.com).
R is an implementation of the S programming language and there is significant compatibility between R and legacy S and S-Plus code as well as between R and the modern commercial version of S, TIBCO Spotfire S+. This makes it possible to convert different versions of S code to run on R without major code modifications.

Website: http://cran.r-project.org
Licence: GPL
Software Version: 3.2.1
Supported Platforms: Windows, Linux, Mac, Unix
Community Support: http://cran.r-project.org/web/views/Spatial.html