
注釈
このプロジェクトはOSGeoLive仮想マシンディスク(VMDK)にのみ含まれています
52 North SOS クイックスタート
52°North SOS は Web サービスで、(空間) 観測データと関連するメタデータへの相互運用アクセスを可能にします。
このクイックスタートでは、次の方法について説明します:
52°North SOS Capabilities にクエリを実行し、サポートするクエリと提供するデータを決定します。
SOS からの観測に関する詳細を照会します。
SOS と共に提供される軽量可視化ツール "Helgoland" を使用して、利用可能なデータを調べます。
クライアント開発者向けの REST API エンドポイントについて調べます。
はじめに
Select : to start the 52°North SOS.
- This will open the 52°North SOS client welcome page in firefox at
http://localhost:8080/52nSOS/ (see Fig. 1).
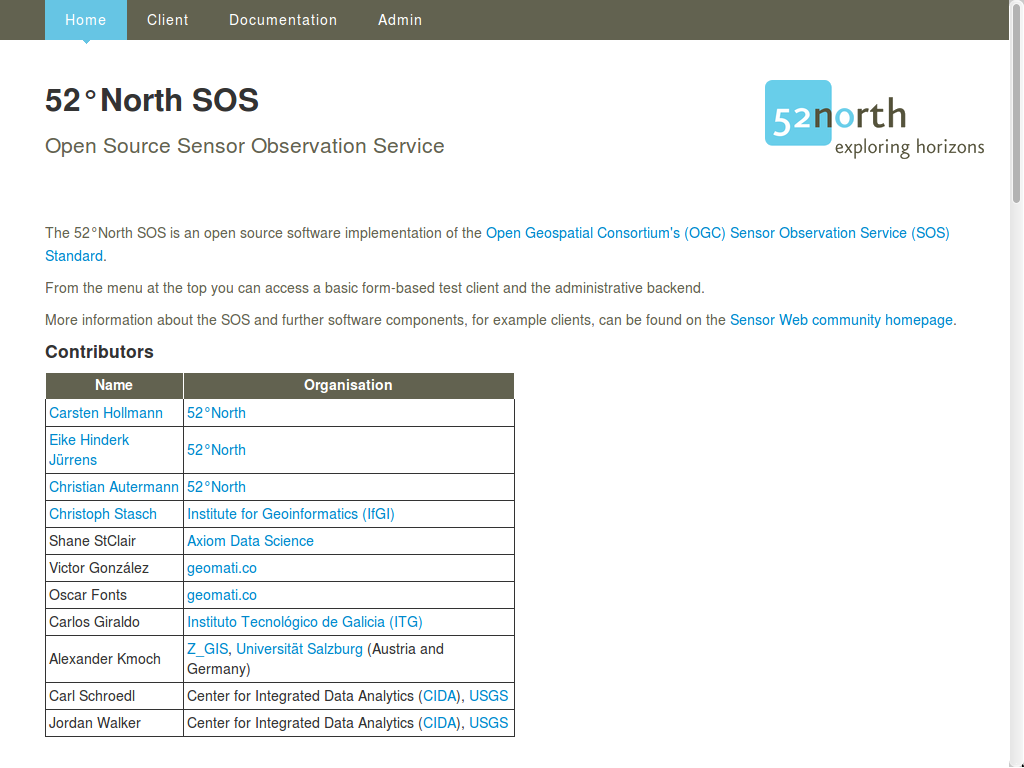
Fig. 1: 52°North SOS client - welcome page.
Click Client from the top menu bar. Once you know the capabilities of an SOS Server, (see Fiq. 2) you can craft appropriate queries. This is made easier by selecting sample queries. Using the information from the capabilities document, you can adjust the available example queries.
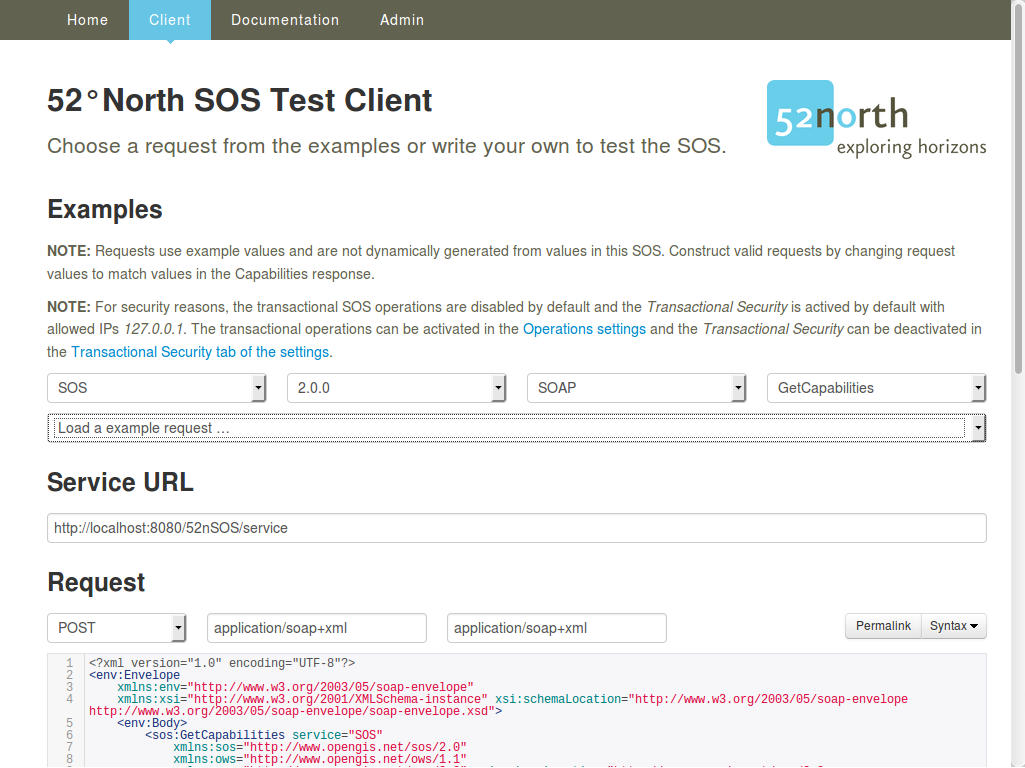
Fig. 2: 52°North SOS client - test client with GetCapabilities request.
To get the available observation data within the time interval from 2018-07-02T23:45:00.000+00:00 to 2018-07-04T23:45:00.000+00:00 for each time series, insert the following request after selecting in the test client's request field:
<?xml version="1.0" encoding="UTF-8"?>
<env:Envelope
    xmlns:env="http://www.w3.org/2003/05/soap-envelope"
    xmlns:xsi="http://www.w3.org/2001/XMLSchema-instance"
    xsi:schemaLocation="http://www.w3.org/2003/05/soap-envelope http://www.w3.org/2003/05/soap-envelope/soap-envelope.xsd">
    <env:Body>
        <sos:GetObservation service="SOS" version="2.0.0"
            xmlns:sos="http://www.opengis.net/sos/2.0"
            xmlns:fes="http://www.opengis.net/fes/2.0"
            xmlns:gml="http://www.opengis.net/gml/3.2"
            xmlns:swe="http://www.opengis.net/swe/2.0"
            xmlns:xlink="http://www.w3.org/1999/xlink"
            xmlns:swes="http://www.opengis.net/swes/2.0"
            xsi:schemaLocation="http://www.opengis.net/sos/2.0 http://schemas.opengis.net/sos/2.0/sos.xsd">
            <sos:temporalFilter>
                <fes:During>
                    <fes:ValueReference>phenomenonTime</fes:ValueReference>
                    <gml:TimePeriod gml:id="tp_1">
                        <gml:beginPosition>2018-07-02T23:45:00.000+00:00</gml:beginPosition>
                        <gml:endPosition>2018-07-04T23:45:00.000+00:00</gml:endPosition>
                    </gml:TimePeriod>
                </fes:During>
            </sos:temporalFilter>
        </sos:GetObservation>
    </env:Body>
</env:Envelope>
Listing 1: Request of observations.
試してみること
Try some of the other example queries from the pull down list.
Try tweaking some of these queries to get different information.
Try the SOS administrator using username
userand passworduser.Try Helgoland - the Viewer Client (see Fig. 3).
Try other sample data by performing the following steps:
Open the SOS administrator database maintenance page.
Empty the database using the "Clear Datasource" button (this will delete the example data. You can restart OSGeoLive to get the data back.).
Insert dynamically generated sample data by clicking the "Insert sample data" button. Please be informed that this operation might take some minutes.
Open Helgoland again and explore the generated sample data.
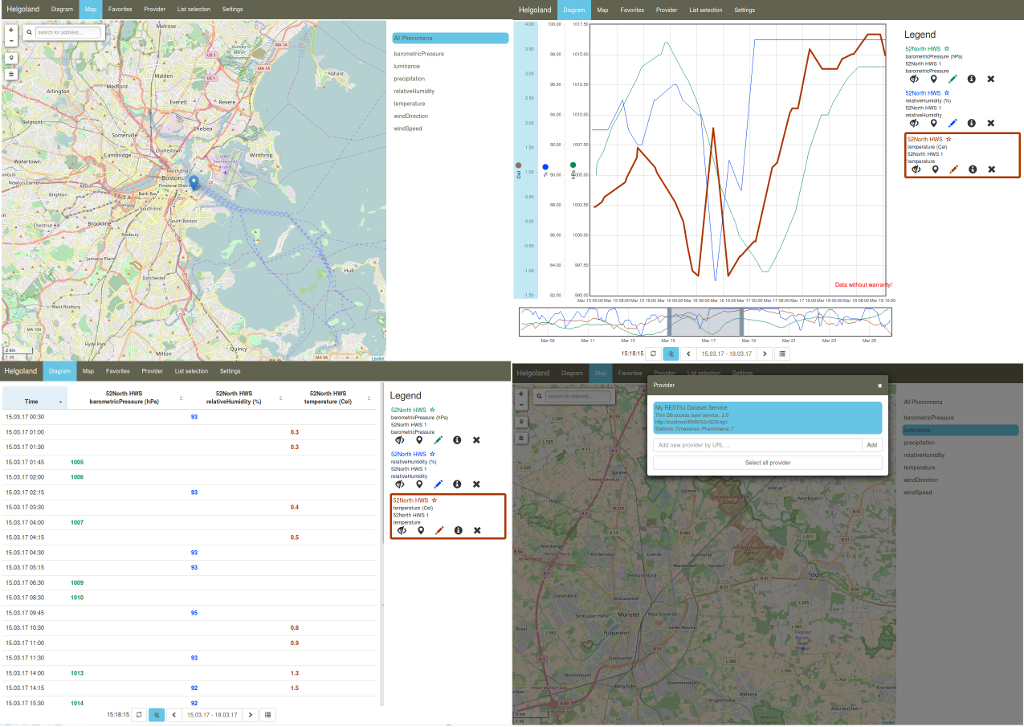
Fig. 3: 52°North SOS client - JavaScript client with time series data.
Try the Sensor Web REST API (see Listing 2):
[
    {
        id: "services",
        label: "Service Provider",
        description: "A service provider offers timeseries data."
    },
    {
        id: "stations",
        label: "Station",
        description: "A station is the place where measurement takes place."
    },
    {
        id: "timeseries",
        label: "Timeseries",
        description: "Represents a sequence of data values measured over time."
    },
    {
        id: "categories",
        label: "Category",
        description: "A category group available timeseries."
    },
    {
        id: "offerings",
        label: "Offering",
        description: "An organizing unit to filter resources."
    },
    {
        id: "features",
        label: "Feature",
        description: "An organizing unit to filter resources."
    },
    {
        id: "procedures",
        label: "Procedure",
        description: "An organizing unit to filter resources."
    },
    {
        id: "phenomena",
        label: "Phenomenon",
        description: "An organizing unit to filter resources."
    },
    {
        id: "platforms",
        label: "Platforms",
        description: "A sensor platform where observations are made."
    },
    {
        id: "geometries",
        label: "Geometries",
        description: "A geometry where observations are made or that was observed."
    }
]
Listing 2: Output of Sensor Web REST API endpoint.
次のステップ
To learn more about the 52°North SOS and/or the 52°North Sensor Web Community, potential starting points are:
52°North SOS overview
52°North Sensor Web mailing list: sensorweb@52north.org
52°North Sensor Web community
52°North SOS Client
52°North SOS Web site
このバージョンの 52°North SOS の開発は、様々なプロジェクト、組織、メンバーによってサポートされています。詳細については 52°North SOS クライアント を参照してください。
我々は、このSOSインストールで利用されているデモデータを提供してくれた、ベルギーの地域間環境庁(IRCEL - CELINE)に感謝の意を表します。The demo data are published under a CC BY 3.0 license.
When the SOS is not available, please check if the tomcat servlet engine is running. Use the following commands:
user@osgeolive:~$ sudo systemctl status tomcat8.service | grep Active
Active: active (running) since Wed 2017-06-21 12:00:42 UTC; 42min ago  <-- Tomcat is running
[...]
Active: inactive (dead)                                                <-- Tomcat not runing, so please start:
user@osgeolive:~$ sudo systemctl start tomcat8.service
Active: active (running) since Wed 2017-06-21 12:52:42 UTC; 3s ago     <-- Tomcat is running, now
Listing 3: Tomcat Status and Start (password for sudo: user).