

GeoServer Quickstart
GeoServer is a java application for serving maps (and data) for other clients (such as web browsers) to draw. GeoServer comes with a browser-based management interface and connects to multiple data sources at the back end.
This Quick Start describes how to:
add a vector and raster data source to GeoServer
apply color to map features using styling
test the layers in a simple web map
learn about clients that can display your maps
add a layer from a NetCDF file
Contents
Start Geoserver
From the Start menu, select . The application will take a few moments to start up and will open a web page at http://localhost:8082/geoserver/web
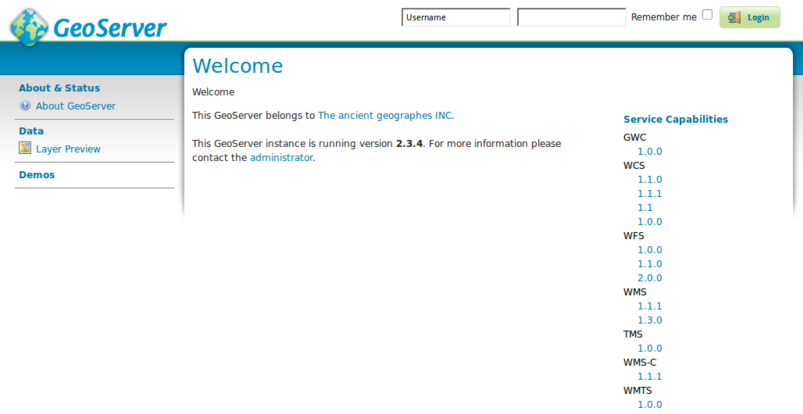
Log in using the username admin and password geoserver. You will now see the admin page.
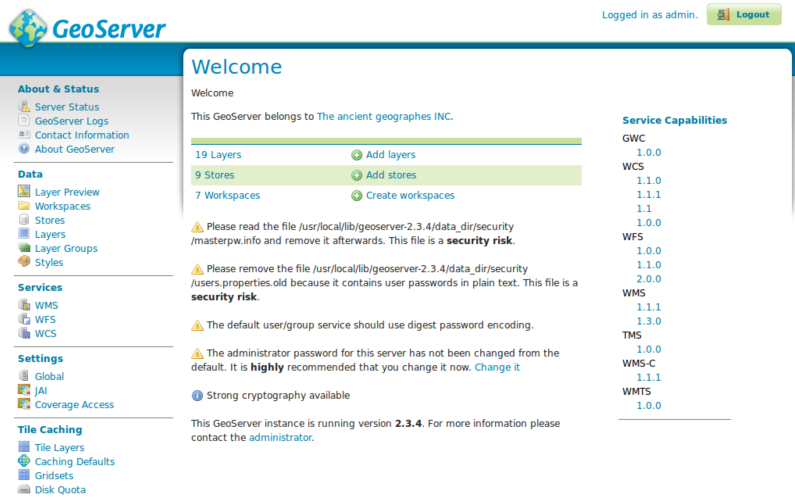
Select the Layer Preview link at the top of the Data section in the left hand menu to see a preview of the layers that are loaded on the server.
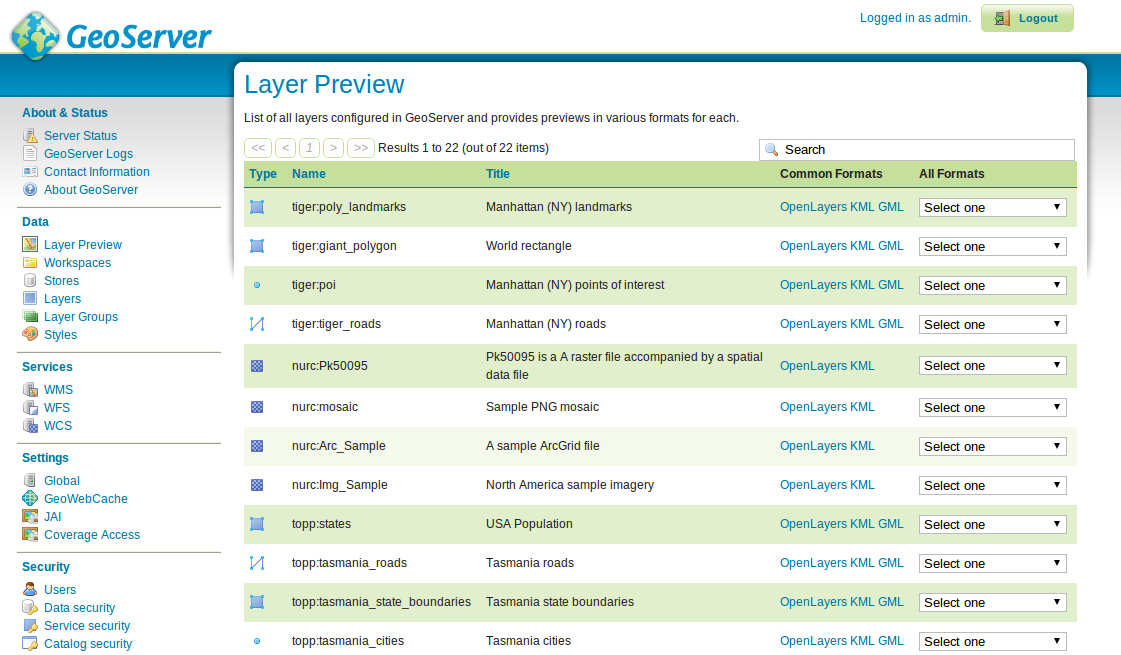
Scroll to the bottom of the page and click on the OpenLayers link in the tiger-ny row. This will open a new window with a preview of some of the sample data.
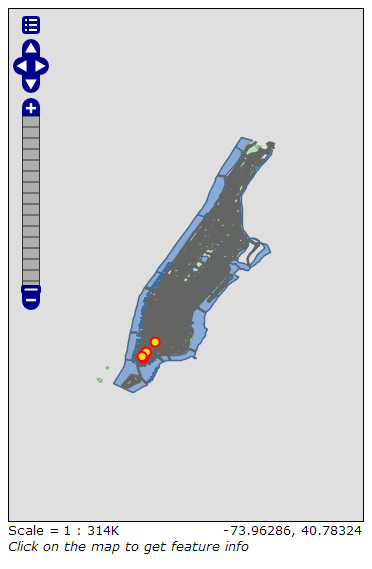
You can zoom in to the map in three ways:
by clicking on the zoom bar on the left, the higher you click on it the more zoomed in you will see.
by using the mouse scroll wheel (if you have one), scrolling up will zoom in and down will zoom out.
by dragging a box on the map while holding down the shift key - this will zoom in to the box selected (or as near as will fit in the screen).
Experiment with this view and look at some of the other previews. Once you are comfortable viewing existing data you can move on to adding some new data.
Loading data
Note
You will not be able to carry out the following steps if you are running with a read only file system (such as the DVD). You will either need to run in a Virtual Machine, or from a USB, or install OSGeoLive (or just GeoServer) onto your hard drive.
In this example we are going to use the Natural Earth data set
that is included on OSGeoLive (/usr/local/share/data/natural_earth2/).
We need to create a Store for our data. From the GeoServer admin page go to Stores.
Click on Add new Store. You will see this page:
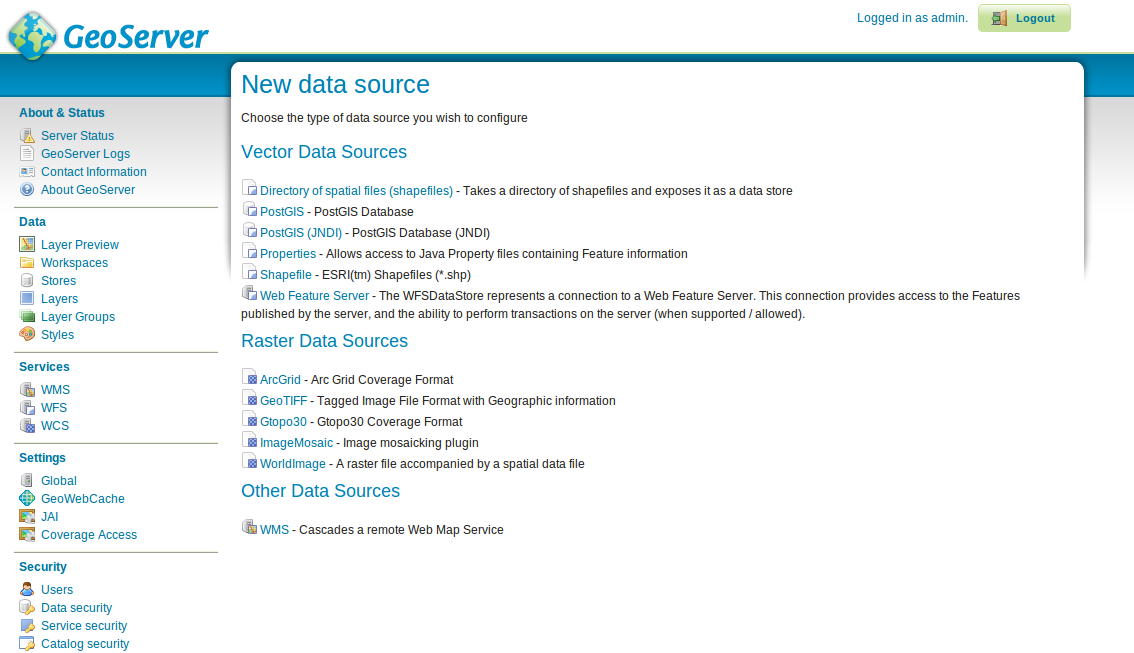
Select the Directory of spatial files. You will see the following:
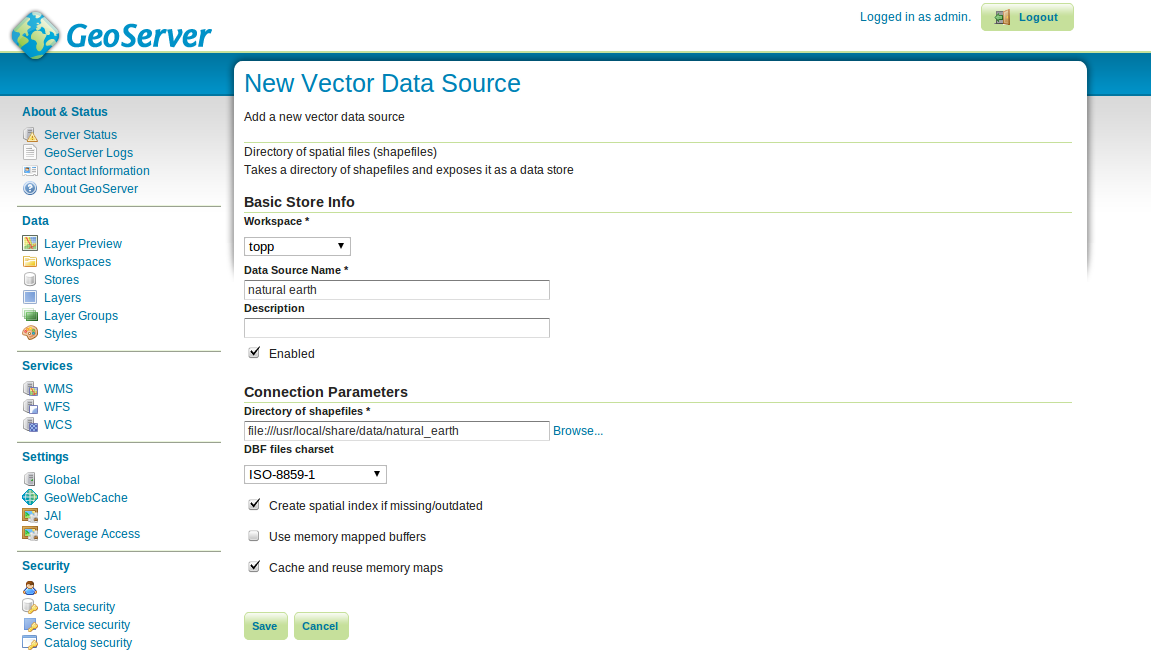
Type in a name for the Data Store (for example, Natural Earth) and fill in the URL to the data set - in this case
/usr/local/share/data/natural_earth2/. You can use the browse button to find the directory if your data is somewhere else.Press save.
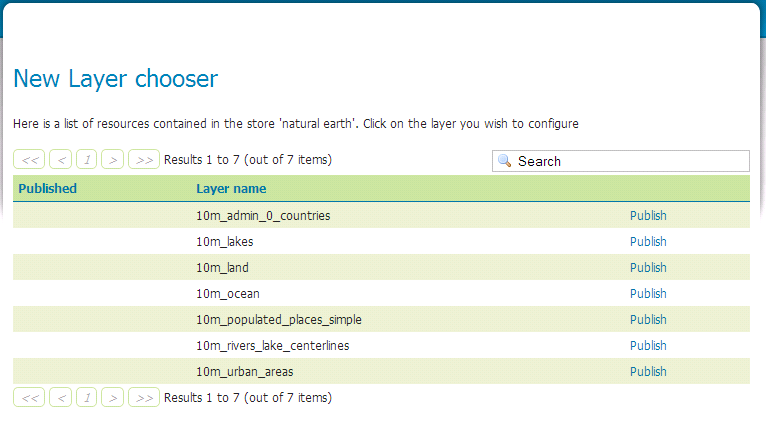
Press publish next to one of the layers to finish adding the data. This will take you to the Layers page:
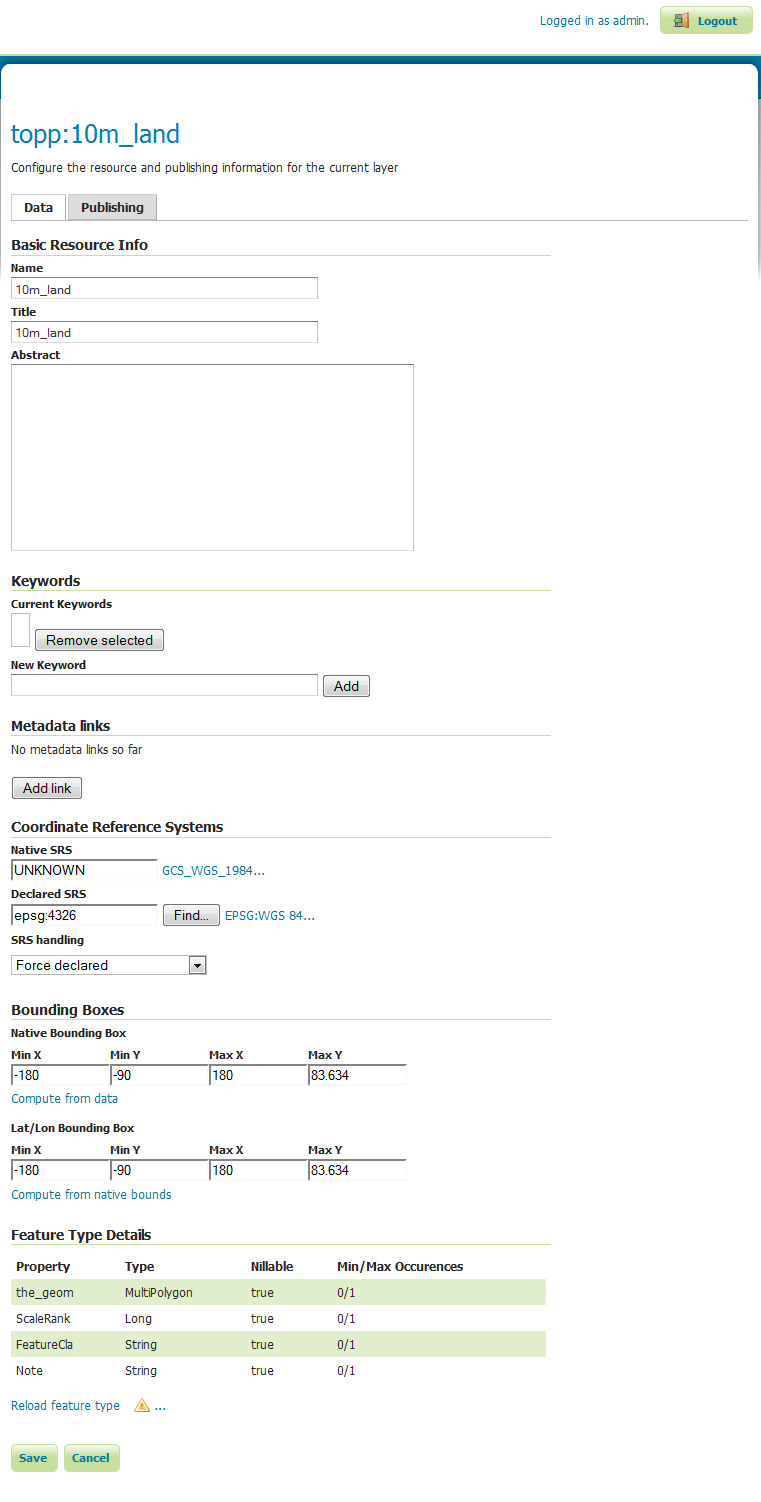
As you scroll down the page you will see that GeoServer has filled in many of the fields for you. When you reach Coordinate Reference System you will notice that under Native SRS it says UNKNOWN you will need to fill in the next box (declared SRS) to make sure GeoServer knows where the data is.
You can type epsg:4326 in the box
Click on Compute from data and Compute from native bounds to fill in the Bounding Boxes.
Finally hit save and you have published your first layer.
Note
Don’t worry if the layer preview doesn’t look very good as it is using the default style. In the next section we will look at producing a nicer style.
You can follow the same step with the other layers in the directory by using the Add a new resource button on the layers page. Just select the natural earth store from the drop down box to get back to the store’s page.
Styling data
Styling a data set into a map layer GeoServer uses an OGC standard called Styled Layer Descriptor (SLD). These are represented as XML files which describe the rules that are used to apply various symbolizers to the data.
To get started, lets style the Land and Ocean datasets. You can create SLD files using a simple text editor, but sometimes a graphical editor is better. There are several options here but uDig allows you to open the shapefiles directly and apply simple styles using a GUI. It also provides a simple editor to modify the XML if I need to.
Using uDig to create simple styles
Note
For more details on how to use uDig see the uDig Quickstart
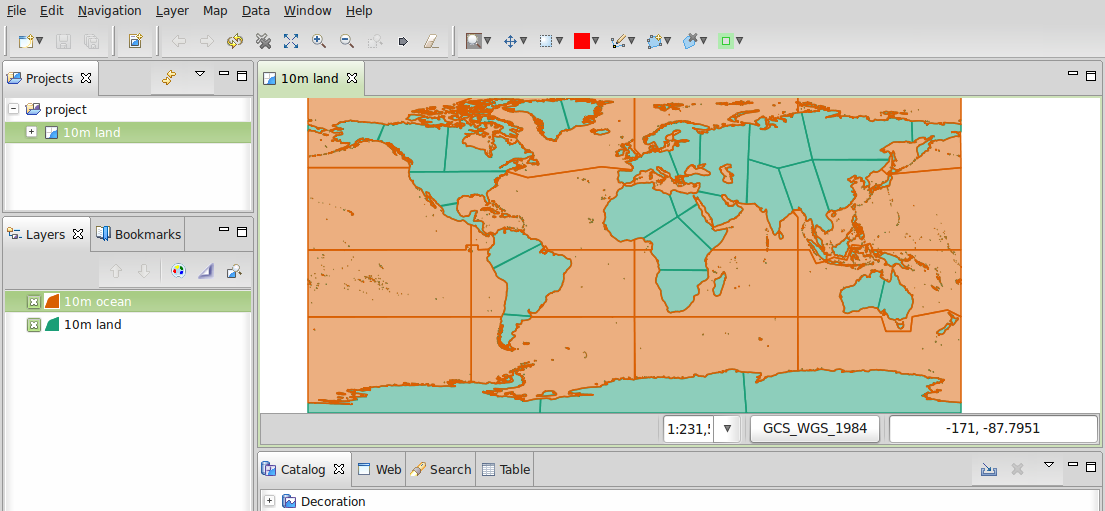
Open uDig and add the shapefiles (using the add data button in the top left hand corner).
Drag the ne_10m_land and ne_10m_ocean tables into the map window. uDig automatically applies a style (so you can see the data).
In the Layer list select the style button (it looks like an artist’s palette).
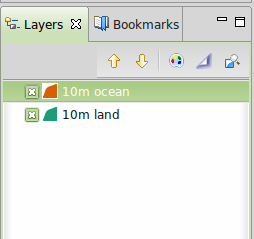
This will open the Style Pane.
In the simple window we can easily select a nice blue for the oceans by clicking on the colored box on the fill tab and choosing from the color picker it produces. We can also increase the opacity of the fill to 100% to make the color look better. Pick the same blue for the border color so it will match.
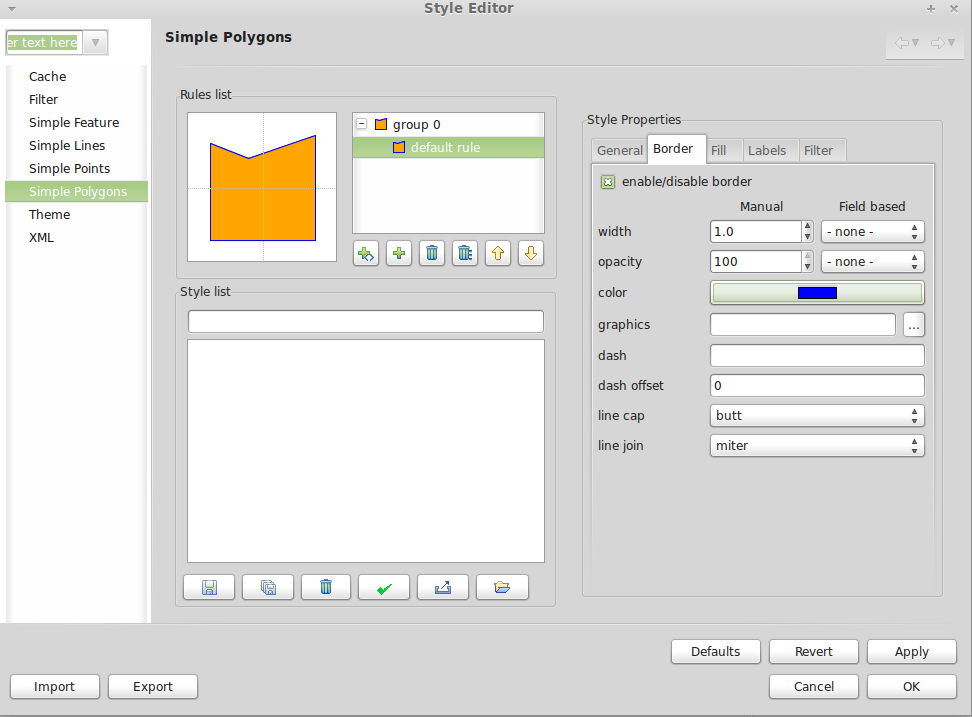
Click
OKand uDig will display the changes.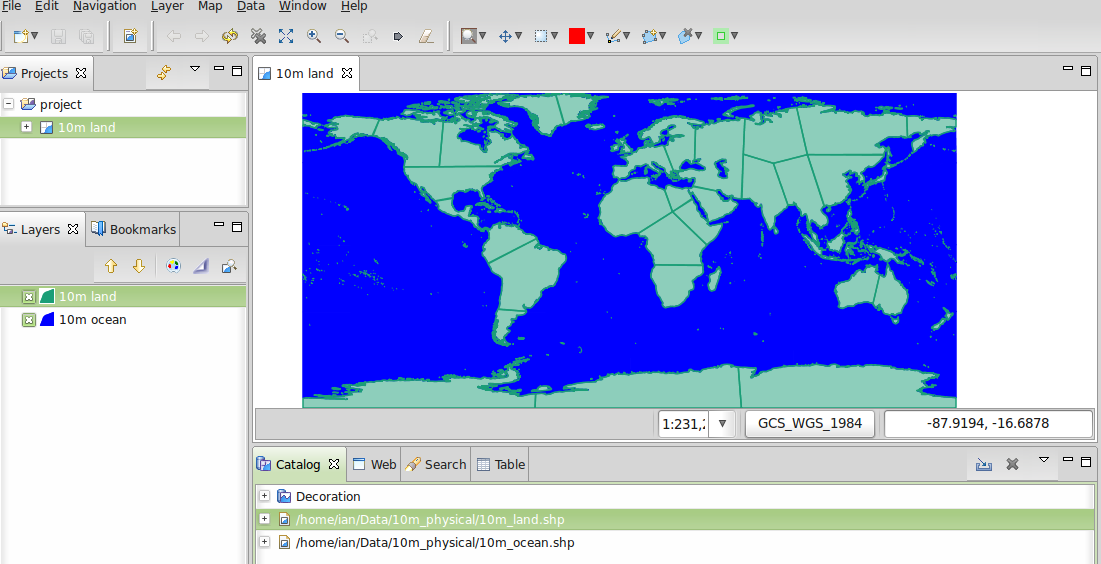
Repeat the steps above to change the color of the land layer. You can use the
define custom colorssection to create your preferred color.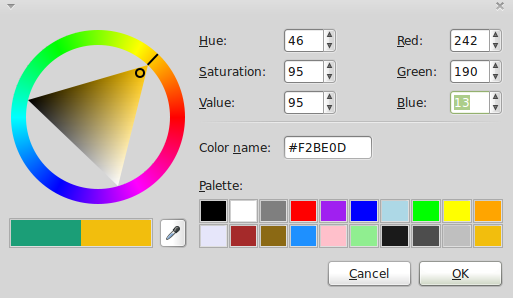
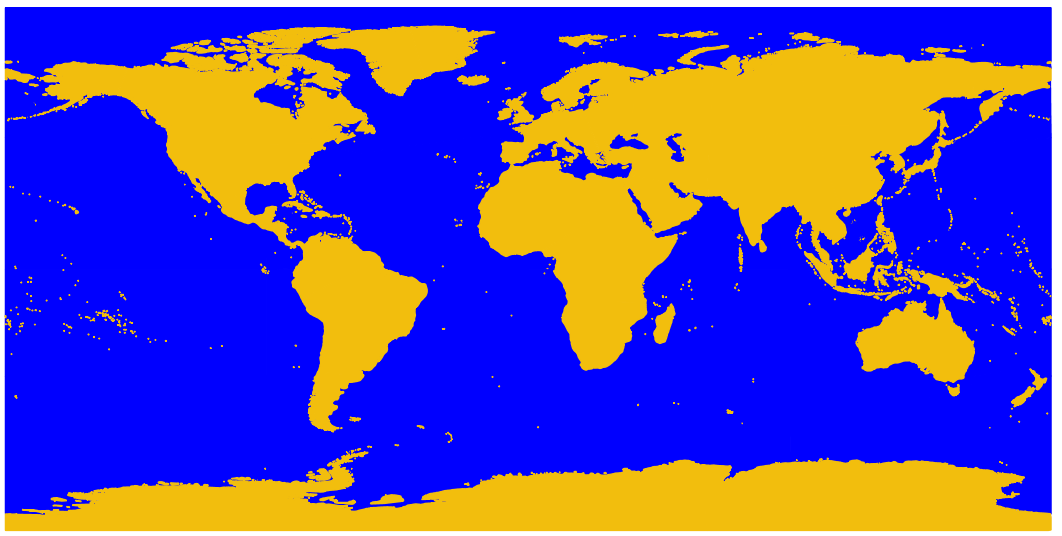
This gives a nice looking basic world map.
Adding the style to GeoServer
Now we need to transfer these styles to GeoServer.
On the style window there is an export button which allows you to save the SLD file that defines your style.
Once saved, you can go to the GeoServer admin page again and select
Styles(at the bottom of theDatasection).Select the
Add New Stylelink. At the bottom of that page is a file upload box and a browse button.Clicking browse to find the files you just saved.
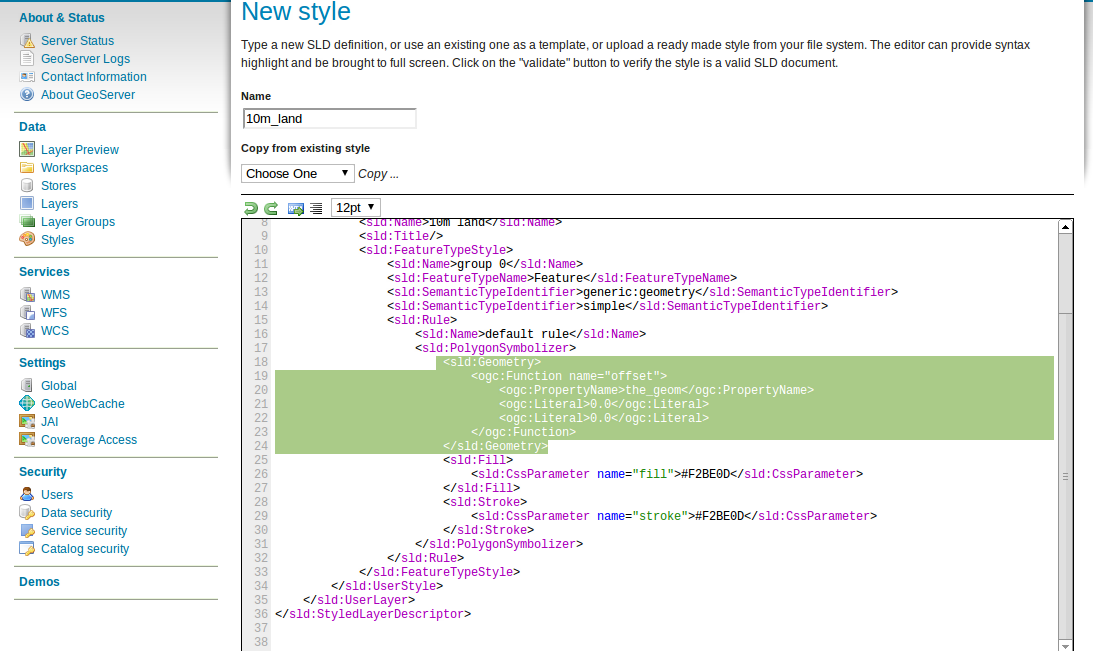
Click the upload link (next to the browse button) and a copy of the file appears in the editor.
If you click on the validate button the highlighted lines will give you an error but you can safely ignore the error (or delete those lines as they don’t do anything).
Press the Submit at the bottom of the page.
Adding the style to the layer
Click on the Layers link in the Menu on the left of the GeoServer window.
Click on the layer (e.g. ne_10m_land), then select the Publishing tab.
Change the Default Style box to the name of the style you uploaded in the previous section.
Now click Save and go to the Layer Preview page to check that it looks good.
Note
There are example style files for all of the example Natural Earth
layers in /usr/local/share/geoserver.
Clients for WMS layers
The Web Map Service (WMS) layers you are serving from GeoServer can be used with a variety of clients on this OSGeoLive distribution, including:
Add a layer from a NetCDF file
The GeoServer NetCDF plugin allows the publication of rasters from NetCDF files.
Configure a NetCDF store
After running “Start GeoServer”
Login as the administrator.
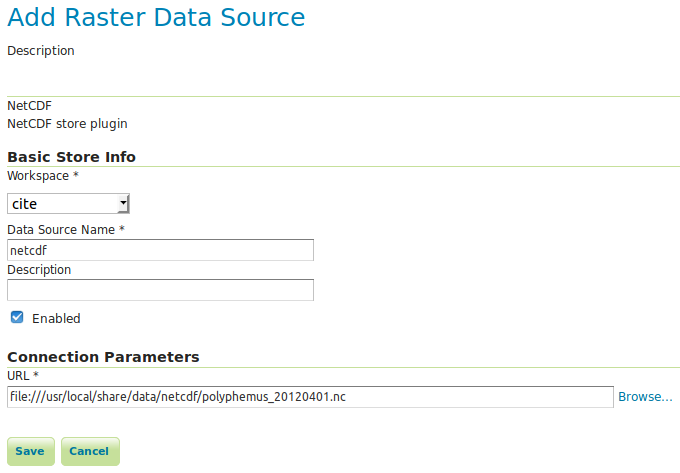
Click on Add stores then NetCDF.
Enter a value for Data Source Name (this example uses “netcdf”) and a NetCDF URL. You can use this sample file:
file:///usr/local/share/data/netcdf/polyphemus_20120401.nc
Press “Save”, “Publish” the “O3” layer.
Scroll down to the bottom of the “Data” tab and press “Save” again.
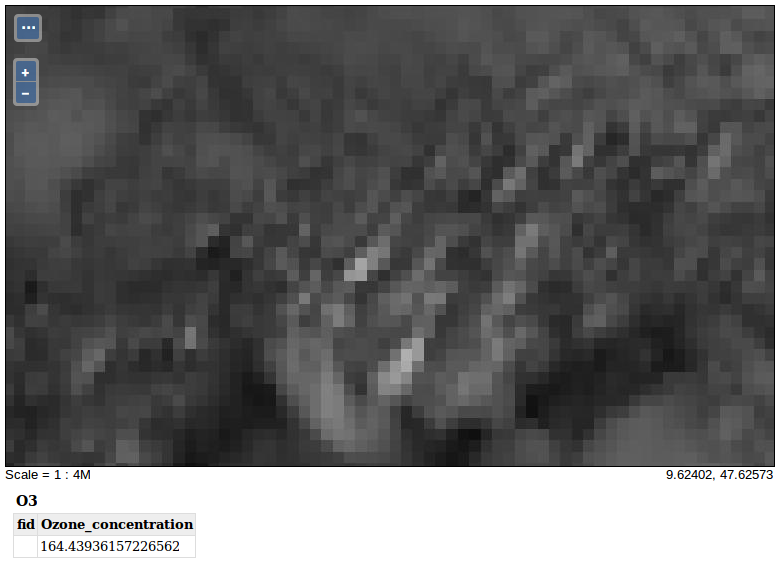
Preview the NetCDF layer
Select “Layer Preview” from the menu on the left
Scroll down to find the “cite:O3” entry, and click on the “OpenLayers” link to show a preview of the layer.
Clicking on points will cause the value of “Ozone_concentration” to be shown in a table at the bottom of the map.
Note
This GeoServer instance has been configured with the NETCDF_DATA_DIR
Java system property to allow the publication of NetCDF files in read-only
directories.
What next?
This is only the first step on the road to using GeoServer. There is a lot more functionality you can try.
GeoServer Project home - https://geoserver.org/
GeoServer User Manual - https://docs.geoserver.org/latest/en/user/
GeoServer Tutorials - https://docs.geoserver.org/latest/en/user/tutorials/index.html
GeoServer Styling Workshop - https://docs.geoserver.org/latest/en/user/styling/workshop/index.html